What is Automated Production Intelligence™?
Manufacturers are looking to data analytics to improve their day-to-day operations—from production to job costing to understanding long-term trends. Today’s CNC machines may generate massive amounts of information about every part run. Still, the data is in proprietary formats, making it challenging to coordinate analysis across machines from different vendors. In short, it’s hard to get a comprehensive, end-to-end picture of what’s happening in your factory.
Forward-thinking manufacturers take matters into their own hands, pulling data from machines and ERP systems by hand. Using Excel or Business Intelligence (BI) tools like Tableau to collect, clean, and load data manually, they look for insights to help make better-informed decisions about their business. Although it’s a painstaking process, trends emerge that provide insights into their operations.
The problem? All of these insights are driven by past events. Historical analysis can be useful in discovering trends over time, but the past does not always predict the future. Changes in personnel or adding new shifts can often translate into significant changes in productivity that invalidate past performance trends and leave manufacturers blind when it comes to what’s happening on the factory floor.
“Information is the oil of the 21st century, and analytics is the combustion engine.“
— Peter Sondergaard, Gartner Research
The Need for Real-Time Production Data
As manufacturers compete for new business, the desire for more data has never been greater. And the need to understand what is happening “right now” is driving the demand for real-time analytics. After spending 100s of hours speaking with manufacturers of all sizes, we realized an analytics gap for modern production floors.
Current production monitoring solutions require operator input and extensive training, providing basic data like status, utilization, and uptime/downtime. The data is interesting but not transformative. And most systems often offer valuable information after the fact, which may be too late.
Instead, you need real-time views of all the jobs in your factory but don’t have the time to learn new software or input data as jobs are running. For real-time production monitoring to be adopted, manufacturers must drastically reduce or completely remove the amount of work that manufacturers must do. Information and insights must be generated automatically and available in a format that is immediately understood and actionable.
Introducing Automated Production Intelligence™
Datanomix took a look at the massive amounts of data available from today’s CNC machines and identified an opportunity to give manufacturers a real-time view of their production. We understand that you don’t need any more work—you need answers. So we built a new generation of production monitoring solutions that deliver the right information at the right time.
The Datanomix platform delivers what we call Automated Production Intelligence™. By simply connecting our system to your CNC machines, we provide real-time insights on every part run and the ability to analyze trends over time. All automatically with No Operator Input™ required. Here’s how we do it:

Connect
We connect to your CNC machines via Ethernet or wirelessly with an external bridge device. Once connected, our Datanomix Edge Device immediately starts analyzing your live production data without disrupting your workflows. Data is “clean” from the start because we base our analytics on machine data, not human input.
Analyze
By running just a few parts, Datanomix creates performance benchmarks for every job you run. Benchmarks are based on your best performance for every part and evolve, providing a stretch goal for future runs of that part. The benchmarks also create a production score—from A plus to C minus—for every job.
Inform
Production scores—or Fusion Factor—for every job are displayed on smart TVs on the shop floor. This easy-to-understand score shows your entire team— in real-time—which jobs are on track and which jobs need attention. Different shifts know how they perform in relation to your benchmarks and other shifts, giving everyone an incentive to achieve.
Improve
Since the Datanomix platform stores the data from every job run, there is a rich repository of historical data that the platform analyzes to show you long-term trends. With this information, you have the data you need to help make better-informed decisions around quoting, costing, and planning to increase productivity and profits.
Continuously
As more machines are connected to Datanomix, the impact increases. More data is analyzed, and the machine learning algorithms get more brilliant. Expertise and insights easily flow from the factory floor to the management level. And better information about utilization and actual costs lead to more business and profitability. It’s a virtuous cycle.
Dashboards and Advanced Reporting
How is Automated Production Intelligence™ materialized with Datanomix? With the information collected, and through the use of advanced analytics and machine learning, Datanomix delivers a host of useful reports and dashboards.
Real-Time Dashboards
Datanomix TV Mode delivers a real-time dashboard to smart TVs on your shop floor. This report offers an up-to-the-minute status for every job running right now. Using the benchmark as the basis, the main dashboard shows the Fusion Factor score, percent of machine utilization against the benchmark, cycle times against the benchmark, Takt Part vs. expected, and more.

Datanomix TV Mode broadcasts performance scores for every job on smart TVs for every manufacturing cell in real time.
Engineers and supervisors can focus on machines with lower grades to get production back on track when everyone can see the score for every job. And with Datanomix, you can dig deeper into the data for every machine to get the complete picture of what’s happening right now.
Full View Reports
Running a morning production meeting has never been easier than with Datanomix. Instead of spending 90 minutes chasing down all the information needed, simply run the Coffee Cup Report to get information on everything that happened in the factory the day before—automatically emailed to the team at 6:00 am every morning.
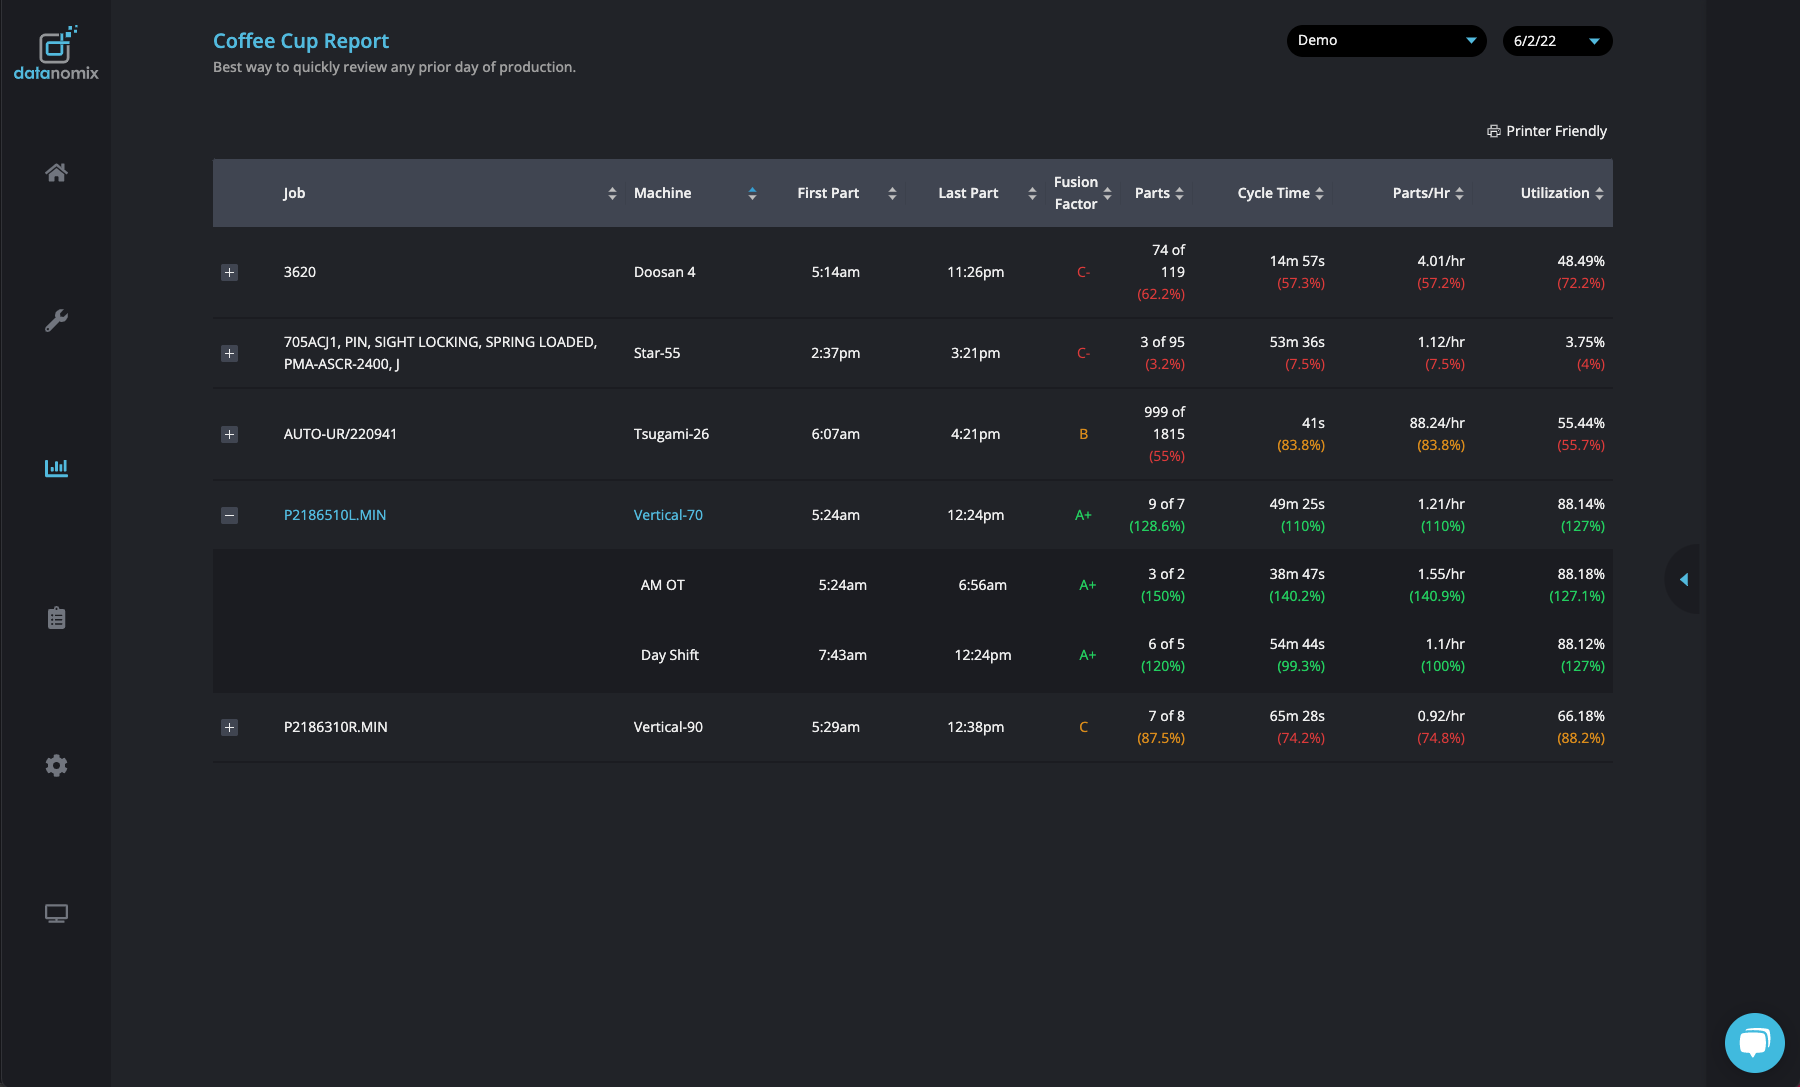
Other valuable reports in Datanomix include the Alarms Pareto report—a daily histogram of all the machine alarms by machine – and the Shift Report—a comparison of job output by shift.
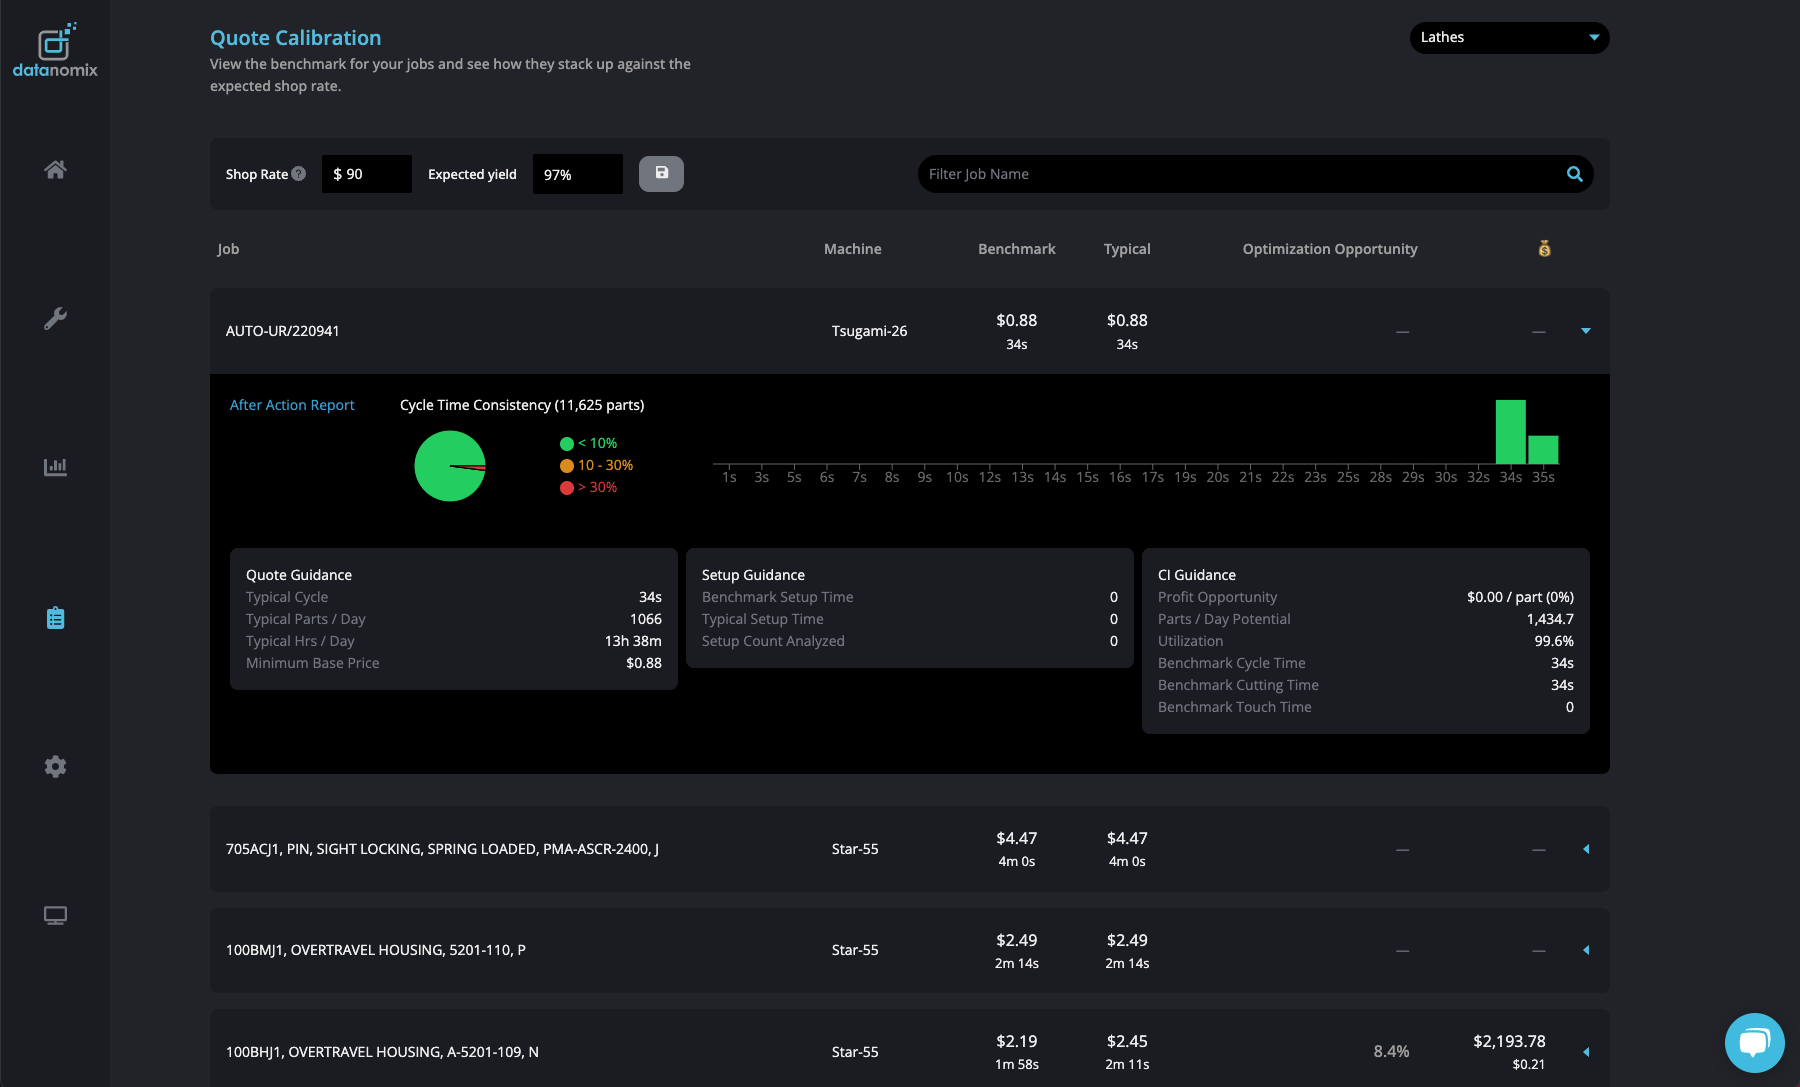
Trend Analysis
Continual improvement requires data analysis over time, and Datanomix helps you understand the actual machine costs for every part run. Our Quote Calibration report gives you your true machine costs based on real setup times, cycle times, and machine utilization, so you know exactly how much to charge and where to focus on improving profitability.
Additional reports like Capacity Planning—which shows utilization by machine over a specific time range—and Factory Trends—offering a complete picture of factory output, utilization, and team scores—give your leadership team insights needed for continually improving operations and ensuring profitability.
The Bottom Line: The Right Data, Right Now
The most common question we get from manufacturers who see a Datanomix demo is:
What type of manufacturing facility did you run?
Even though we have not run a manufacturing facility ourselves, we listened to what the manufacturers had to say and spent time learning about the data they needed to keep their factories running at peak efficiency and profitability. Every company wants to understand its operations in real-time, from job shops to high-volume manufacturers, while having the long-term data to make better-informed strategic decisions.
The bottom line is that with Datanomix, you have a system that shows you what’s going on in real-time and the context to better understand your business over time. All without having to do any of the heavy lifting needed to learn new software or the inefficiencies of operator input. Just the right data right now.