Get More With Datanomix Production Monitoring
More uptime. More profitable cycle times. More insights into continuous improvement opportunities. We took the time to listen to thousands of people in manufacturing to understand what they needed to know to run their production floors efficiently. Then we built a system that delivers that information to them without needing tablets to collect data or an IT person to interpret it.
Get Answers To Important Questions…
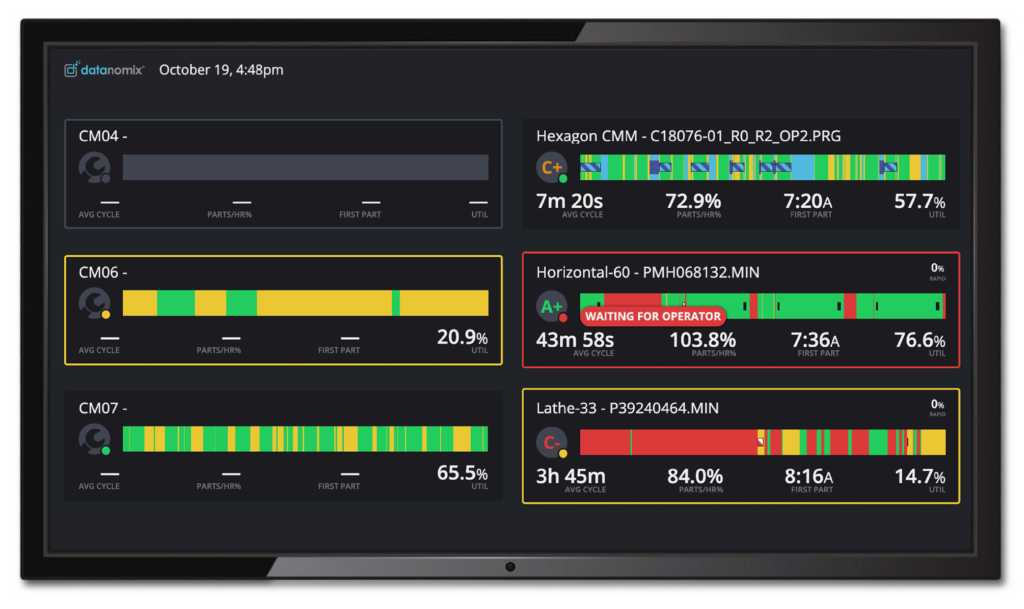
What’s Happening Right Now?
Everyone on the shop floor can just look up to see LIVE data broadcast on large-screen TVs using Datanomix TV Mode. It provides the ability to address stopped machines as a team—and resolve issues faster. Configurable menu of rotating live dashboards includes:
- Stopped Machines and what they are waiting for
- Takt Parts
- Current Cycle Times Compared to Target Cycle Times
- Cell Performance
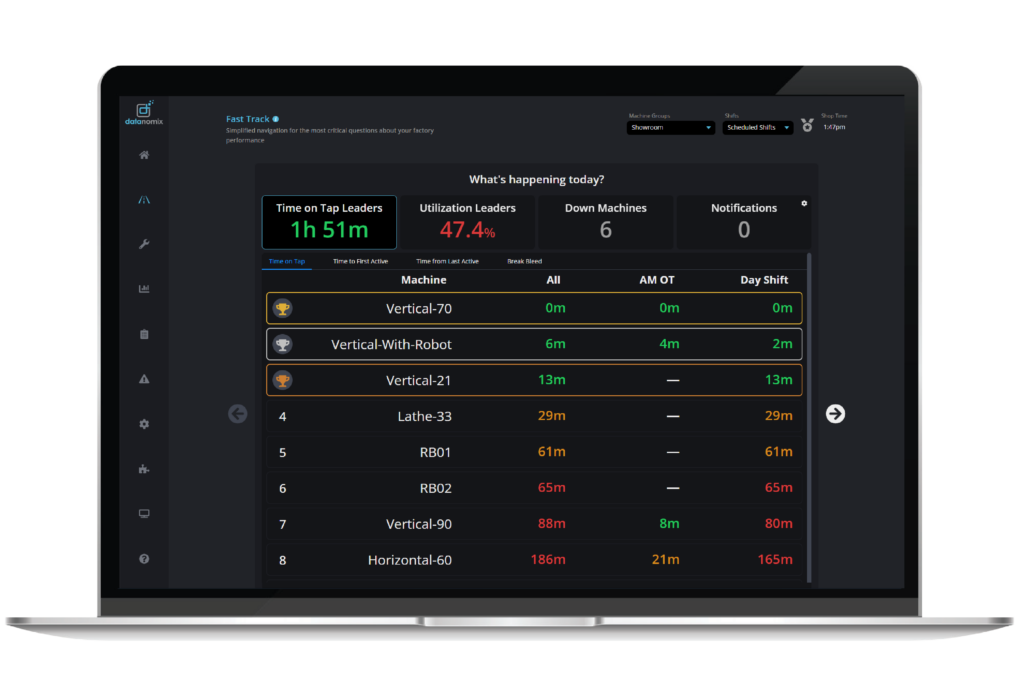
What’s Happening Today? What Happened Yesterday? How Are We Trending?
These are three big questions that every facility needs answers to on a daily basis. The Fast Track dashboard is your one-stop-shop to get those answers.
- Today: Leader Boards for Time on Tap and Utilization, Down machines & notifications
- Yesterday: Time on Tap, Availability, and Espresso Report
- Trending: Capacity, Utilization, and Time on Tap
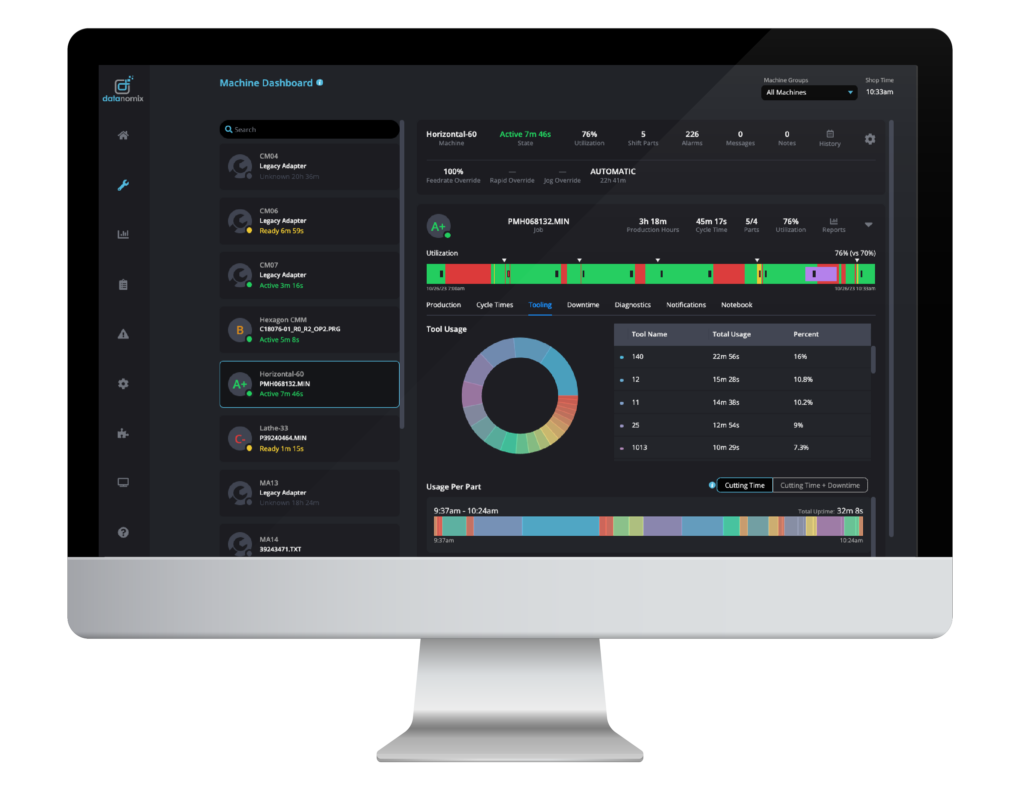
Are We Meeting Our Benchmarks Today?
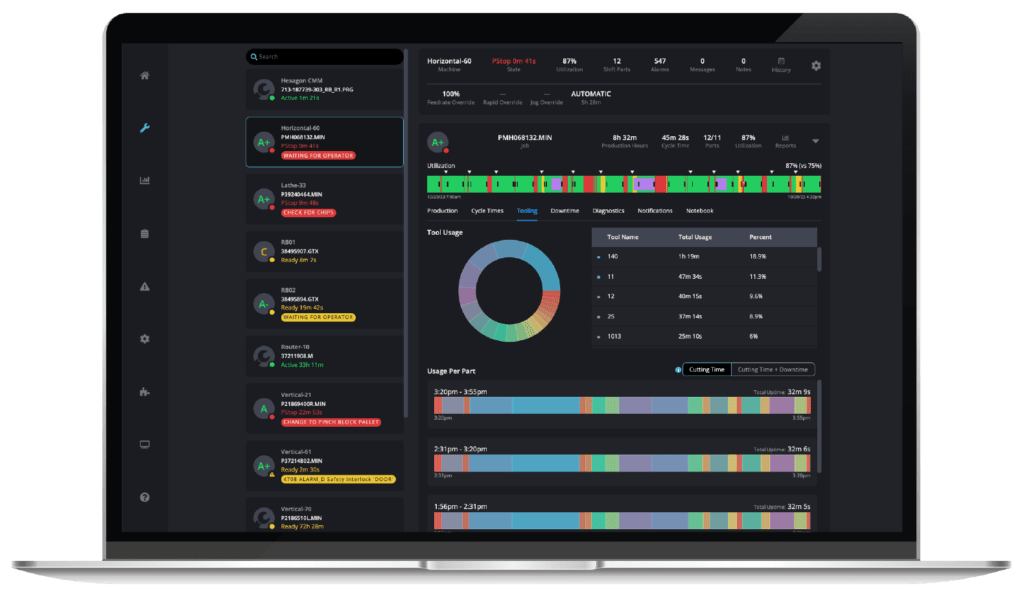
With Datanomix, you only need to run a few parts on the machine to automatically establish a benchmark for what good production looks like. We analyze and visualize Takt parts, cycle times, utilization, and throughput for each job you run and compare the current performance to the benchmark using a simple scoring system that grades real-time output from A+ to C-. Everyone on the team knows exactly where to focus their efforts.
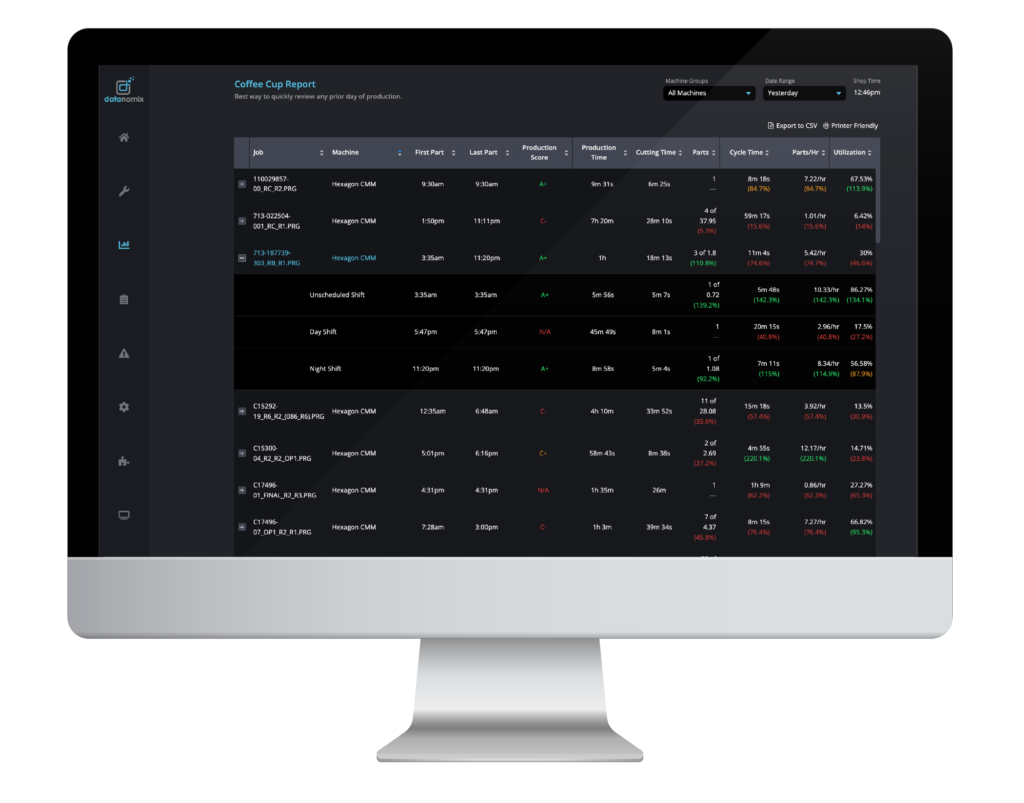
How Did We Perform Yesterday?
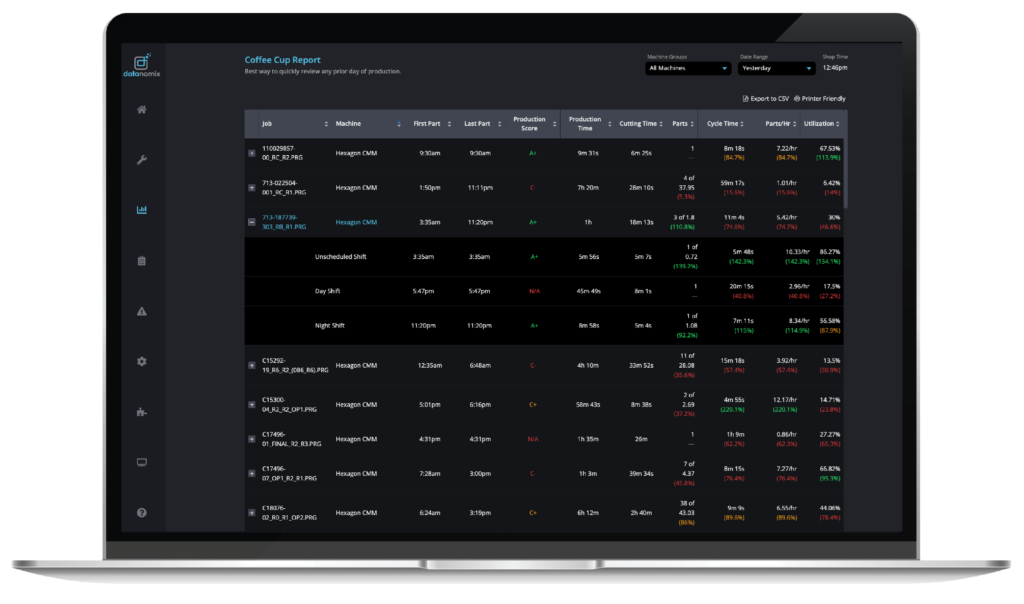
Operations managers tell us they spend 60 to 90 minutes every morning gathering information on what happened the previous day for the morning production meeting. The Coffee Cup Report automatically provides a summary of yesterday’s production delivered to your inbox every morning at 6:00 a.m. Run a successful production meeting by addressing issues instead of chasing people, paper, and parts.
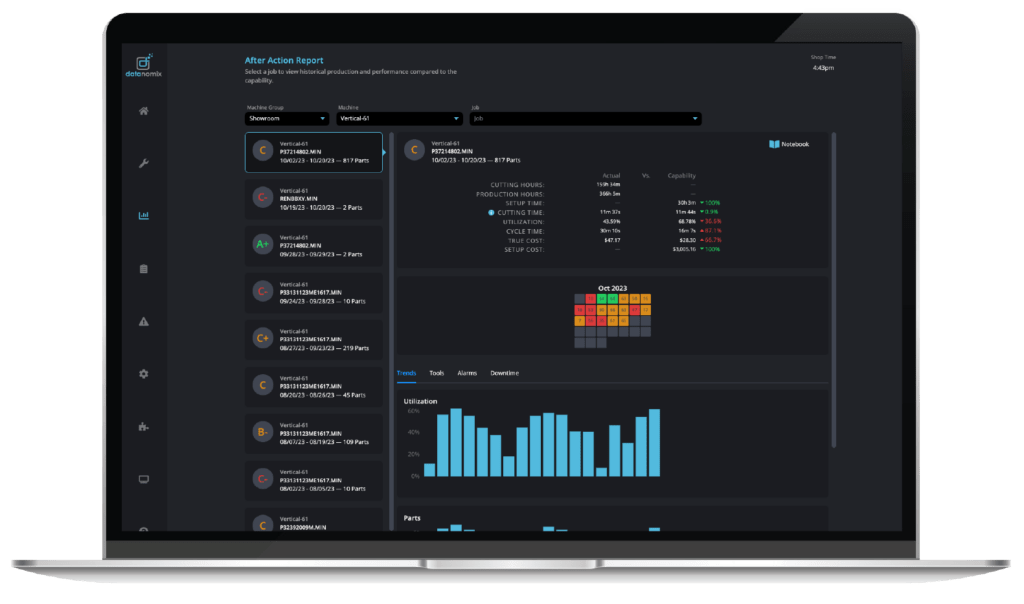
How Did We Do On That Job Compared to Last Month’s Run?
Understand the raw capacity and utilization of your factory or job-specific details with our After Action Report. The Report offers insights into performance at a per-job and per-machine level over any given time range, helping with decision-making around staffing, job costing, and capital expenditures. It’s a postmortem for all jobs you run.
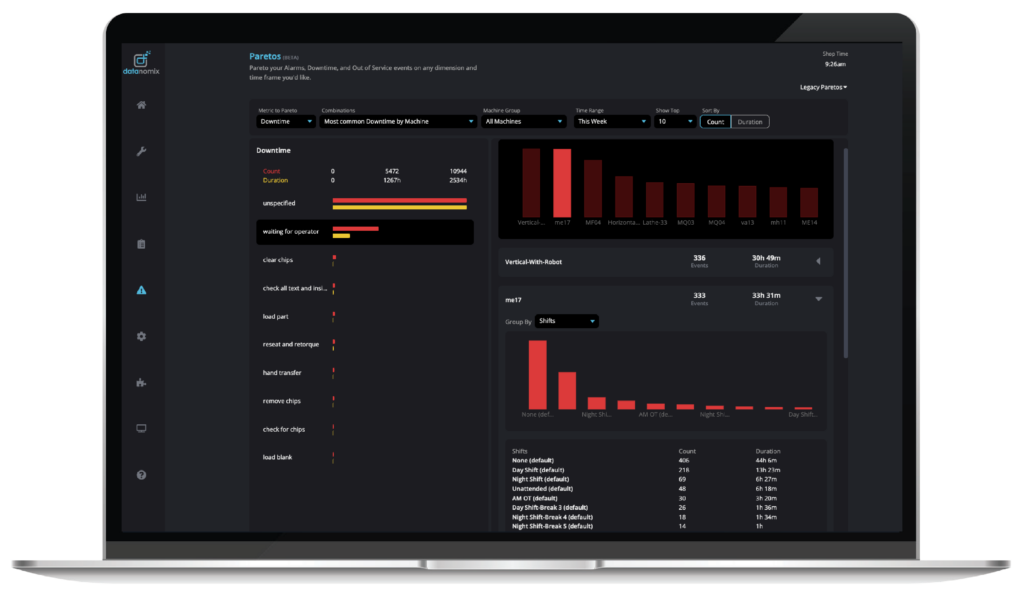
Why Were My Machines Down? Is There a Pattern?
Our Automated Downtime InsightsTM automatically categorizes the reasons for expected and unexpected downtime during live production, providing a clear target for which processes to improve and without any operator input required.
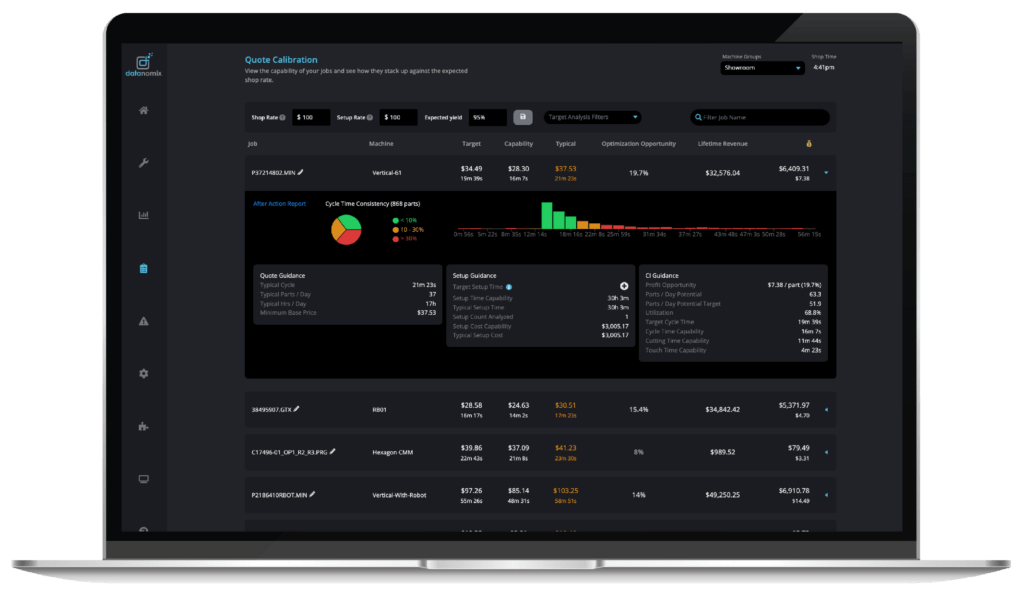
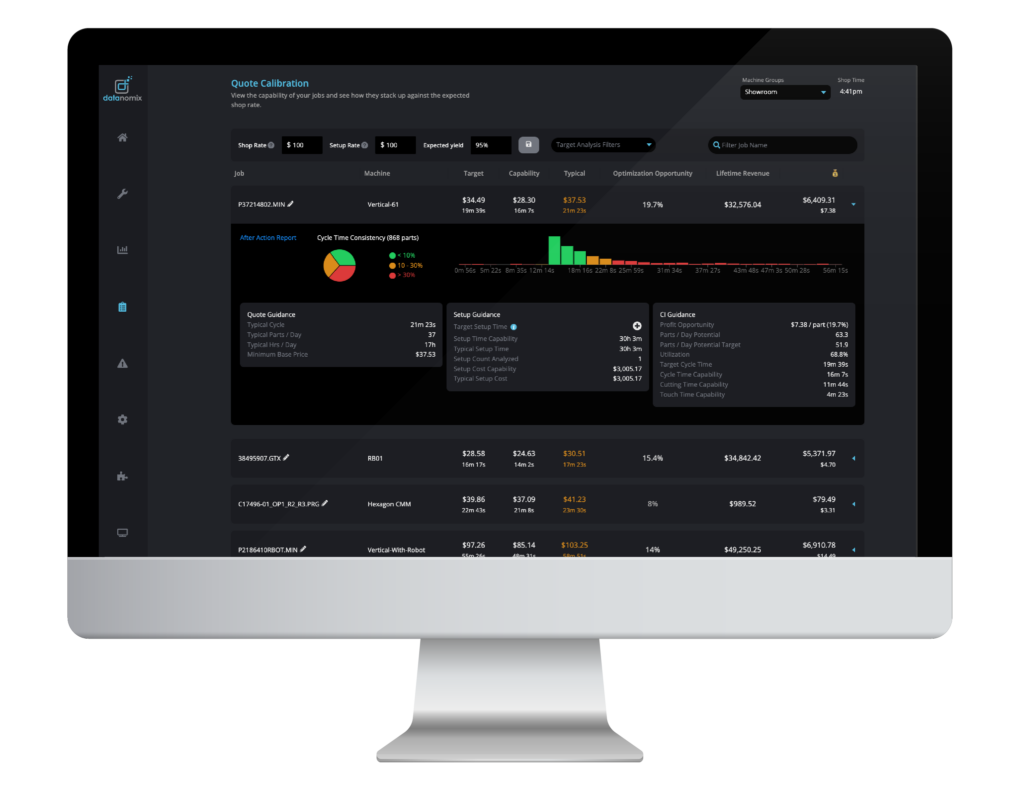
Are We Quoting Jobs Accurately? Where Did We Lose Money?
Accurate quoting can be notoriously tricky, causing profitability issues or reducing your quotes’ competitiveness by adding too much “fudge factor.” Our Quote Calibration Report gives you instant access to proper job performance so you can reconcile actual costs against your estimates to find the best opportunities for margin and optimization.
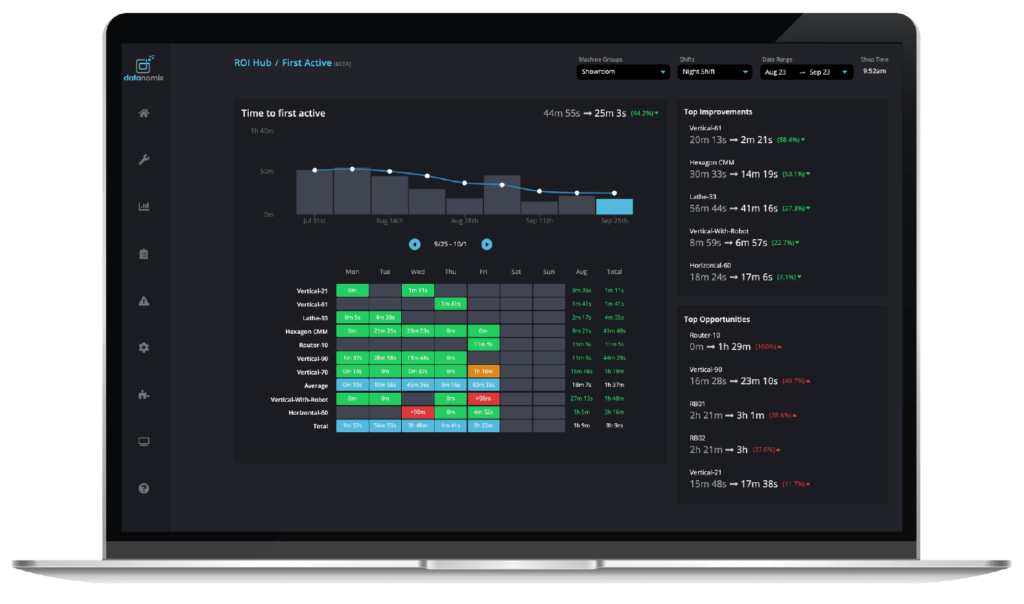
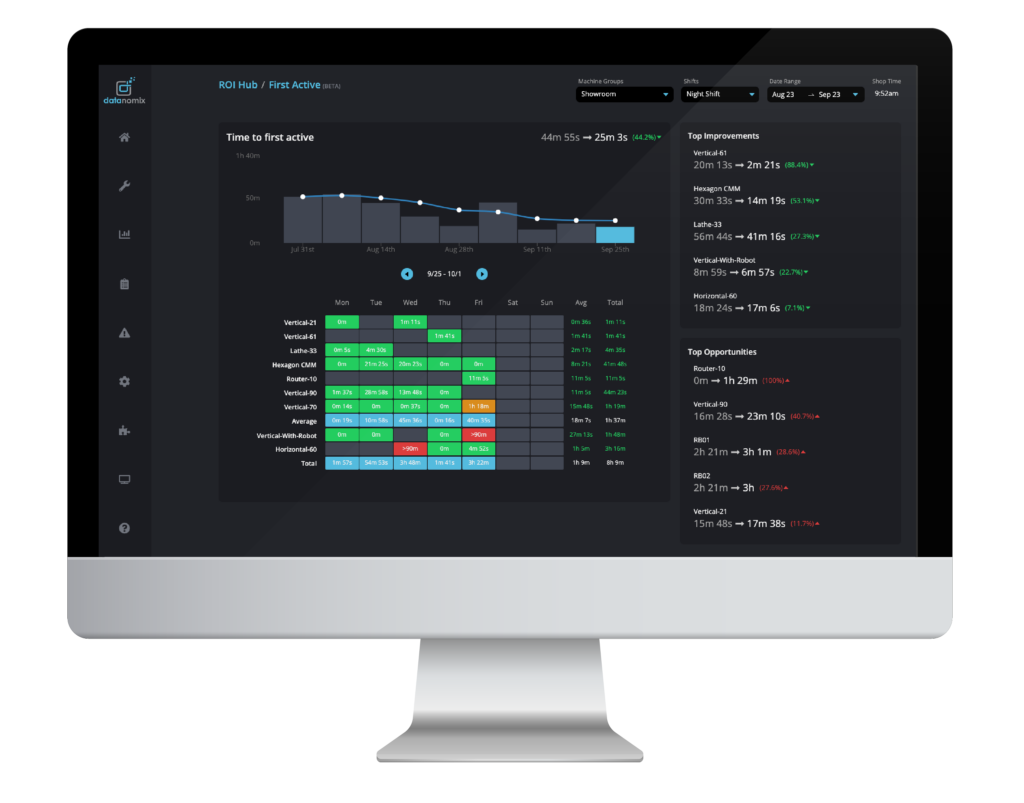
Are Our KPIs Getting Better or Worse?
Our Continuous Improvement Hub (CI Hub) consolidates job performance KPIs for factory health into a single dashboard that allows you to quickly track and validate top improvements and opportunities in machine utilization, time to first active part, and cycle time achievement.
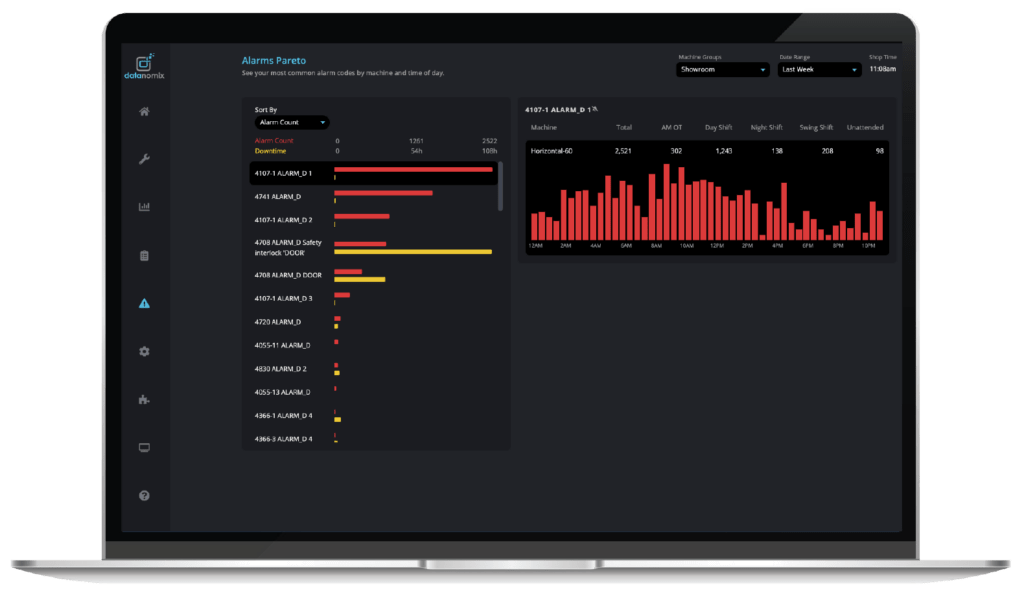
What Alarms Are Causing The Most Downtime? How Long Did It Take Us To Make This Part Last Quarter?
Right out of the box, Datanomix delivers the reports and visualizations you need to improve across all aspects of your factory’s operations. An Alarms Pareto Report shows you the most common alarm codes by machine and time of day, and our Scheduling Dashboard shares the history for each job on each machine to help you plan out your schedule based on past results.
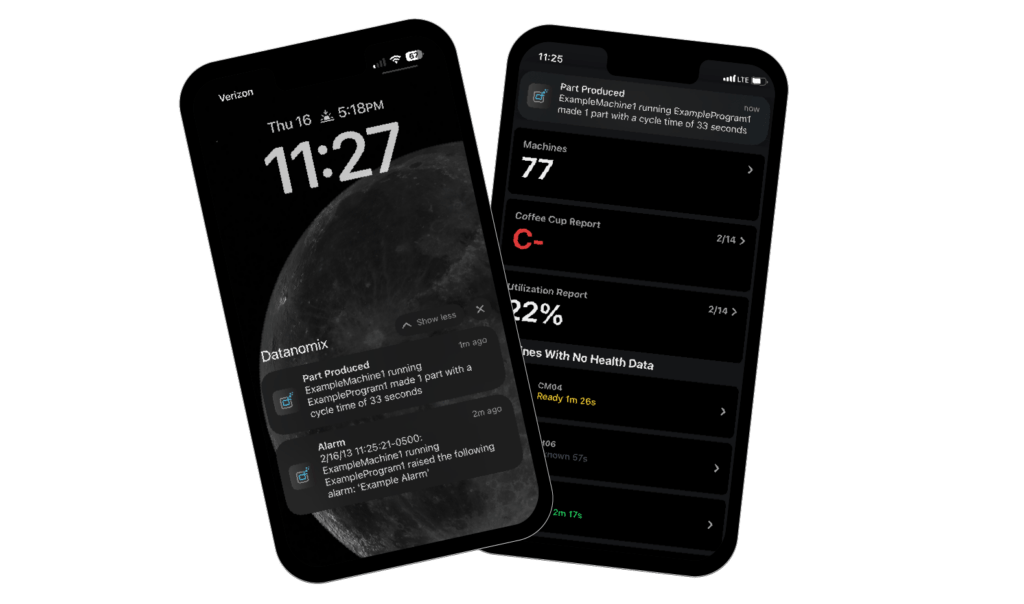
What’s Going on While I’m Stuck in Meetings?
With the Datanomix mobile app for iOS and Android devices, customers can see the status of their Datanomix-connected machines to track job performance in real-time on a smartphone or tablet. Customers can also configure push notifications and pull up their most important reports, including the After Action, Coffee Cup, and Quote Calibration reports.
Plus Kick-Ass Implementation, Service, and Support to Get You Up and Running FAST!
With Datanomix, it’s never been faster—or easier—to get started with real-time production insights for your factory. Our Onboarding Dashboard accelerates the installation and training of Datanomix at your facility. The dashboard is a communication hub between your team and Datanomix Customer Success, with an easy-to-follow and transparent workflow that ensures a smooth and efficient onboarding experience.
Unlock productivity, streamline operations, and increase profits with real-time production monitoring software from Datanomix!
Datanomix Benefits Every Shop Type—Across Any Industry
Datanomix has helped hundreds of shops in all shapes and sizes achieve their revenue and profit goals.


Datanomix ROI Calculator
Calculate How Much More Revenue You Can Get with Datanomix

Connects to all major makes and models of CNC Machines
Datanomix Production Monitoring FAQs
- Can you monitor older machines?
Sure, we can monitor older machines—the real question is do you need to monitor them? We will work with you to determine what’s best for your shop.
- Measure uptime and downtime with an amp clamp
- Depending on the model, some cycle time data might be available too.
- Why does Datanomix not rely on reason codes?
With Datanomix, there is no reason for reason codes.
“The underlying assumption is that reason codes are necessary because the software doesn’t understand how a job is supposed to run, and therefore cannot possibly tell you whether something is running well or poorly. However, Datanomix has developed an adaptive algorithm that establishes a standard for optimal performance across various metrics, such as cutting time, probing time, touch time, and the number of planned stoppages per cycle, among others. Through G-code analytics, we can determine the cause of each stoppage and the expected duration for each event. Once you have these elements of job performance, you fully understand your process capability without putting any additional burden on your operators.”
—Greg McHale, Founder & CEO, Datanomix - How does your scoring system work?
By running just a few parts, Datanomix creates performance benchmarks for every job you run. Benchmarks are based on your best performance for every part and evolve over time, providing a stretch goal for future runs of that part. The benchmarks are also used to create a production score—from A plus to C minus—for every job.
Production scores for every job are displayed on smart TVs on the shop floor. This easy-to-understand score shows your entire team—in real-time—which jobs are on track and which jobs need attention. Different shifts know how they are performing in relation to your benchmarks and to other shifts, giving everyone an incentive to achieve.
- How does your software get the benchmark for cycle time? Does someone need to enter a benchmark for every job?
This is one of the things that makes us unique—we don’t require operator input for anything. Our software automatically figures out benchmarks for cycle time, parts/hr and utilization just by doing statistical analysis on the data coming from your machines.
- What’s involved in getting the system setup?
We typically just need WiFi network information and can take it from there. We plug a device into your CNC machines which sits on the WiFi network and is collecting real-time data.
- How many users does your licensing include?
Our pricing is per machine per year, not per user. You can have as many user accounts as you’d like.
- Can this data integrate with my ERP system?
It certainly can, although the vast majority of our customers choose to run us as a standalone system because of the value of our information and the quality of our user interface.
Use ProShop?
A ProShop ERP integration is now available inside the Datanomix platform. By enabling this integration, Datanomix automatically matches part numbers in the machine code to those from the ProShop ERP system and extracts target takt times. These targets are integrated into the Datanomix Quote Calibration Report to quickly identify opportunities for margin improvement by comparing the ProShop target takt times to Datanomix actuals and benchmarks. Pre-packaged filters in the report show exactly which jobs to work on —Biggest Winners, Biggest Losers, Losers that Could Be Winners, and Winners with Upside— are a Continuous Improvement leader’s dream.If you are looking for deeper insights from your ERP system, you should consider our Digital GEMBA Board.
Do You Want More?
Unlock productivity, streamline operations, and energize growth.
Request a demo today.