Fast Track
Built for Shops that Want to Tackle Downtime Head-On & Improve Machine Efficiency
Used daily to gain clarity on your shop’s performance and attack common wastes that are killing your uptime and utilization.
Rapid Answers to the Questions That Matter Most
Through helping 100’s of shops, we’ve identified common wastes that slow down every manufacturer—no matter what you make. That’s why every Datanomix customer starts with Fast Track.
If you don’t have clean visibility into your machine data, this is your first step. Fast Track puts all the key production answers in one place, so you know where to focus right now, what happened yesterday, and if you’re trending in the right direction.
For manufacturers that want to tackle downtime head-on and improve machine efficiency—without adding more work to the day, Fast Track is one of our most powerful tools. Learn more on our blog.
“Datanomix provides important information to our programmers and operators that show them ways they can take time off parts.“
Devon Gray, Machinist
Paramount Machine | Salt Lake City, UT
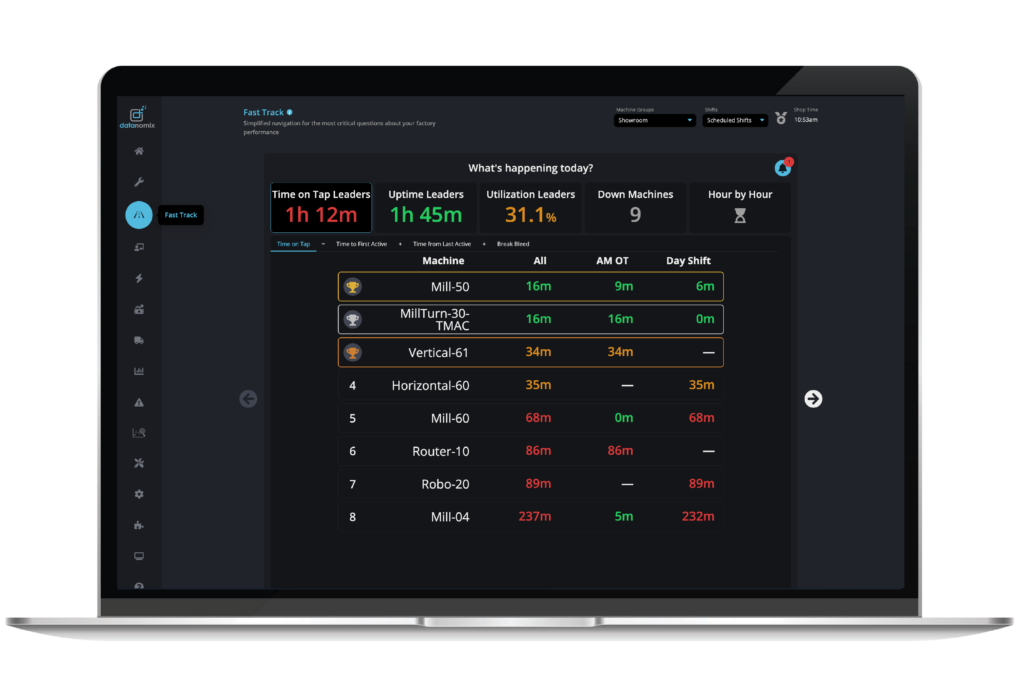
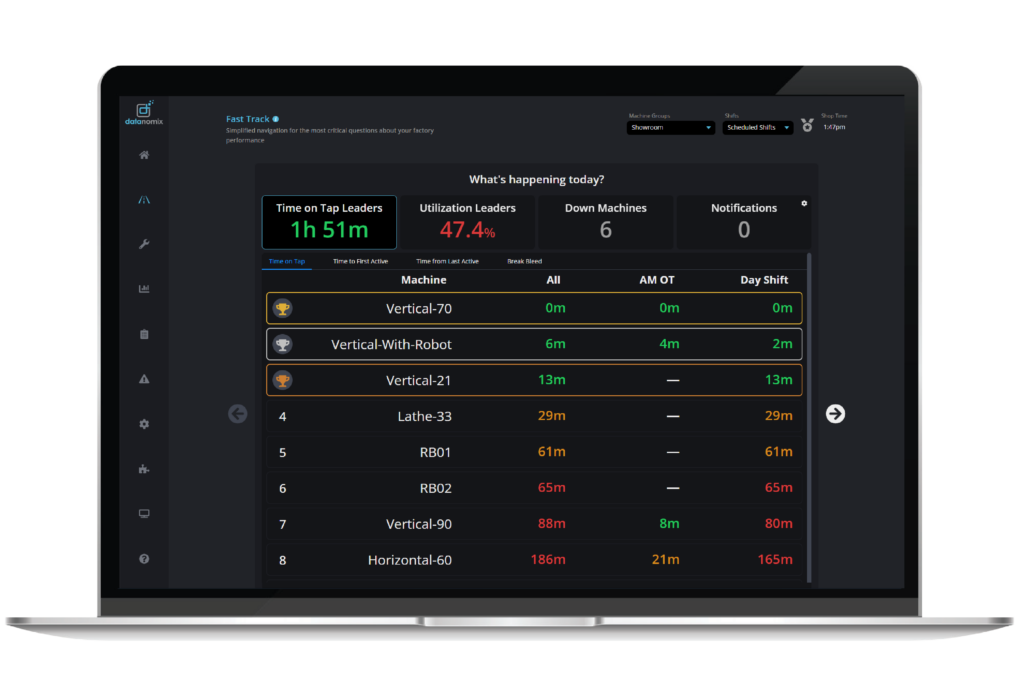
What’s happening today?
▼
Keep your finger on the pulse of production throughout the day. Easily see which machines are hitting it out of the park and where you need to focus your attention to stay on track.
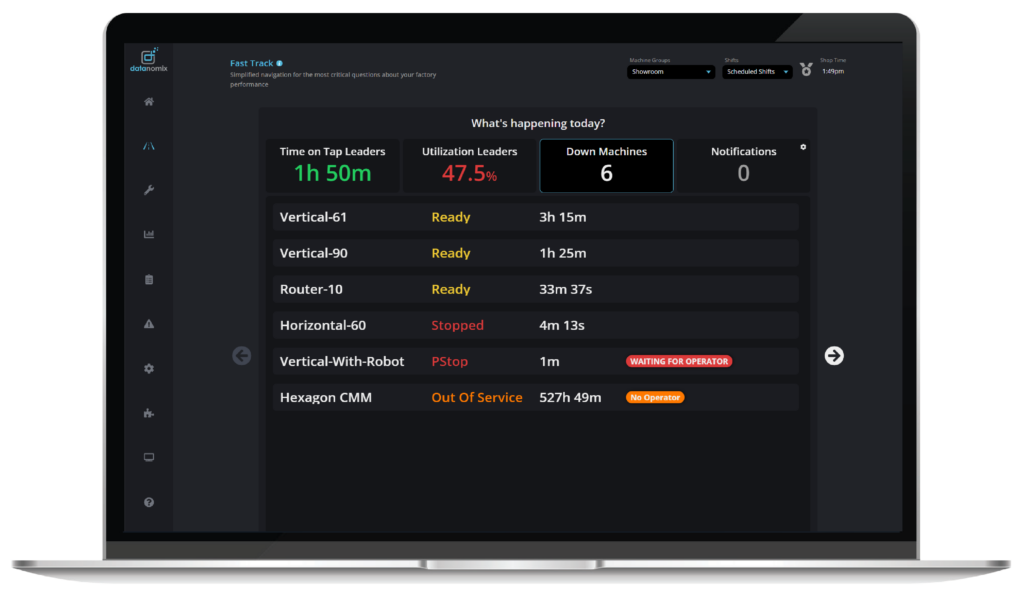
Identify what needs attention right now.
What happened yesterday?
▼
View yesterday’s performance and the week in progress to identify issues that might keep you from achieving your production targets.
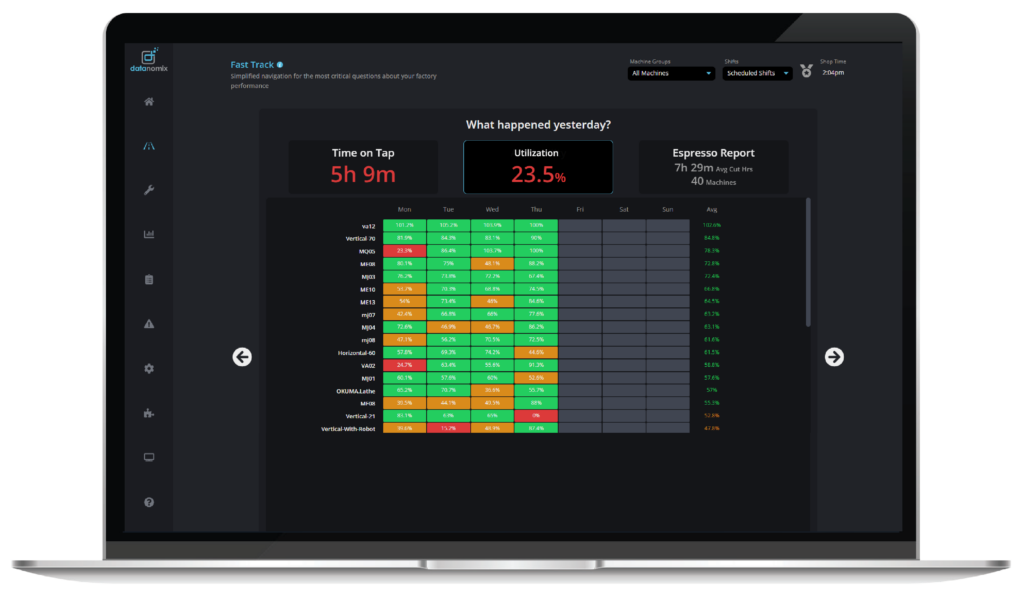
See the utilization % by machine for yesterday and the week in progress.
How are we trending?
▼
Knowing how your performance trends are critical to validate if corrective actions and new initiatives are working as planned. Check trends by the week, month, quarter, etc. A great way to get a macro view of performance.
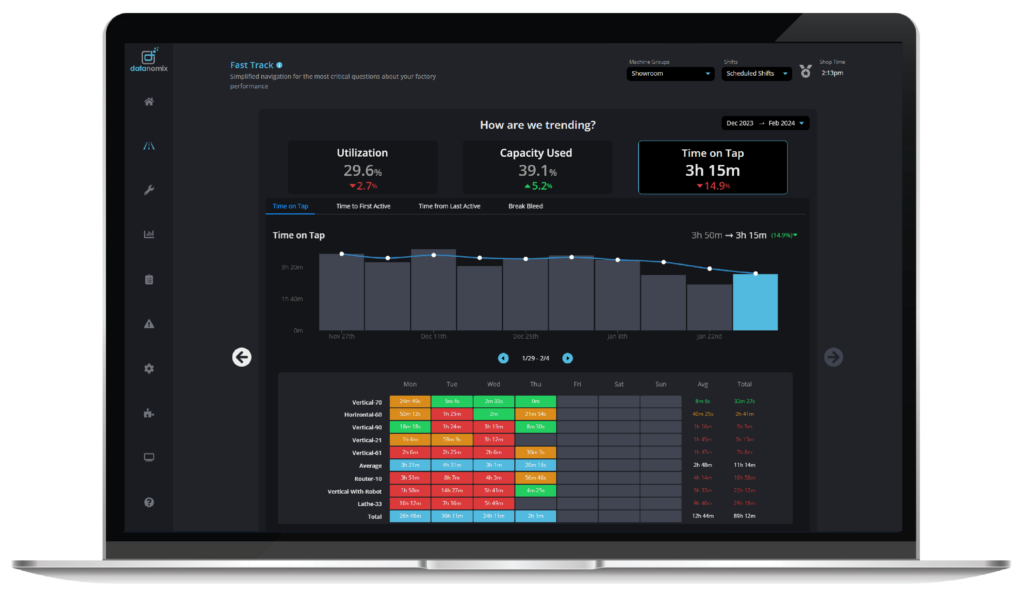
See how you are doing overall and in each individual transition time
COMMON WASTE LEADERBOARD
See today’s performance for every connected machine and
Identify common wastes to boost efficiency and save money.
Identify what needs attention right now.
See the utilization % by machine for yesterday and the week in progress.
See how you are doing overall and in each individual transition time
WEBINAR:
Proven Ways to Reduce Downtime and Boost Your Bottom Line
See how to uncover hidden downtime, fix it faster, and turn lost margins into growth.
“I can see it on my phone or check it on my computer, so at any time I can see what these machines are doing.”
Mike Jones, Swiss Line Lead
Rolar Products | Muskegon, MI
The Three Pilot Plays
Every new Datanomix customer starts with three plays: a focused plan to recover machine hours, boost uptime, and introduce every team member to the power of live data. With Fast Track, TVs on the Shop Floor, and our Mobile App, you’ll eliminate common wastes while helping operators and supervisors prioritize their attention.
ROI Calculator
How much more could your shop be making with Datanomix?
