Real Shops. Real Wins. Real Fast.
See how Hastreiter Industries unlocked 10- 20% productivity gains in just weeks—without changing their team, parts, or process. Learn how Pazmac now has unprecedented visibility across their entire operations, and ARCH Medical monitors unattended machines with real-time notifications and alerts.
“Connect us up to your machines, let our software do its magic, and it will come up with performance standards and actuals on its own. Hook us into your ERP instance, and you’ll get automated analysis on exactly which part numbers you need to be focused on from a job costing and margin improvement standpoint”
Greg McHale, Founder & CEO
Datanomix
“For years I didn’t think we were ready for machine monitoring. I always thought, ‘That’s more for production environments.’ But Datanomix is very beneficial in a job shop. When you’re dealing with a lot of changeover, it helps you understand what’s taking so long and how to eliminate it.”
Kody Guidry, Co-Owner
Coastal Machine & Supply | Carencro, LA
Improve Response Time
Datanomix doesn’t just show you what’s happening—it tells you what to do next. The right insight, at the right moment, for the right person. With our Production Monitoring software your team will respond in real-time. Here’s what your team will act on daily to improve efficiency and production perfromance:
- Underperforming machines before they burn a shift
- Jobs falling behind before they derail delivery
- Common Wastes before it becomes lost margin
- Operator pacing issues before they impact throughput
- Tooling problems before they turn into scrap
- Delivery risks before your customer ever feels them
- Smarter Gemba Walks grounded in real production data
- More effective Kaizen events focused on data you can trust
Kick-Off With Our “Prove it” Pilot Program
With Datanomix, you don’t wait weeks to see value. We give your team the visibility, focus, and momentum to improve performance from day one.
Start Strong
▼
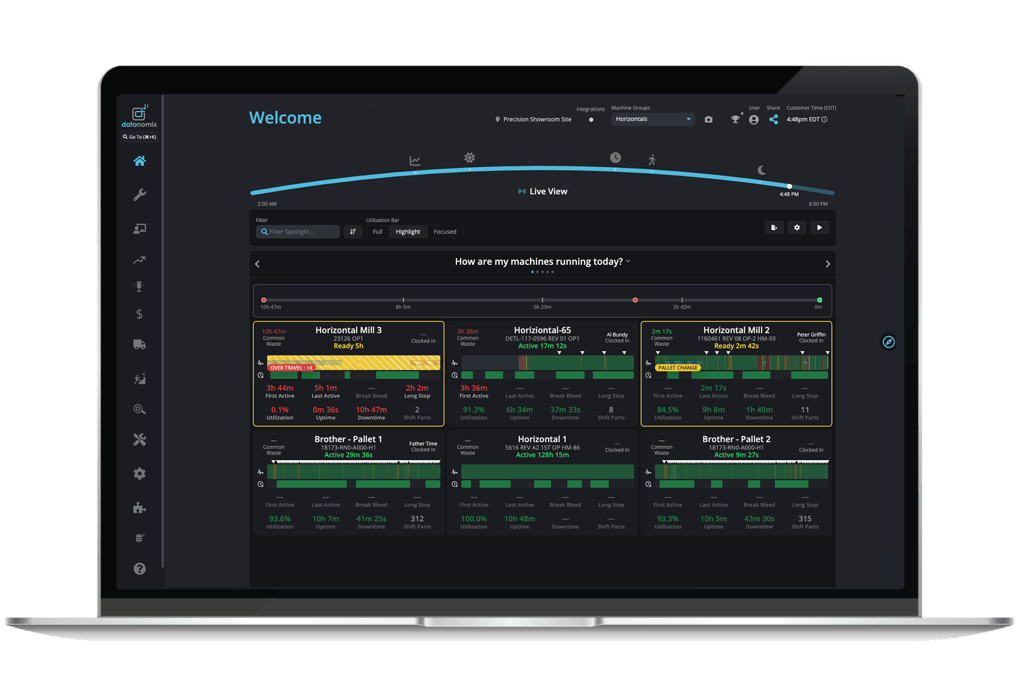
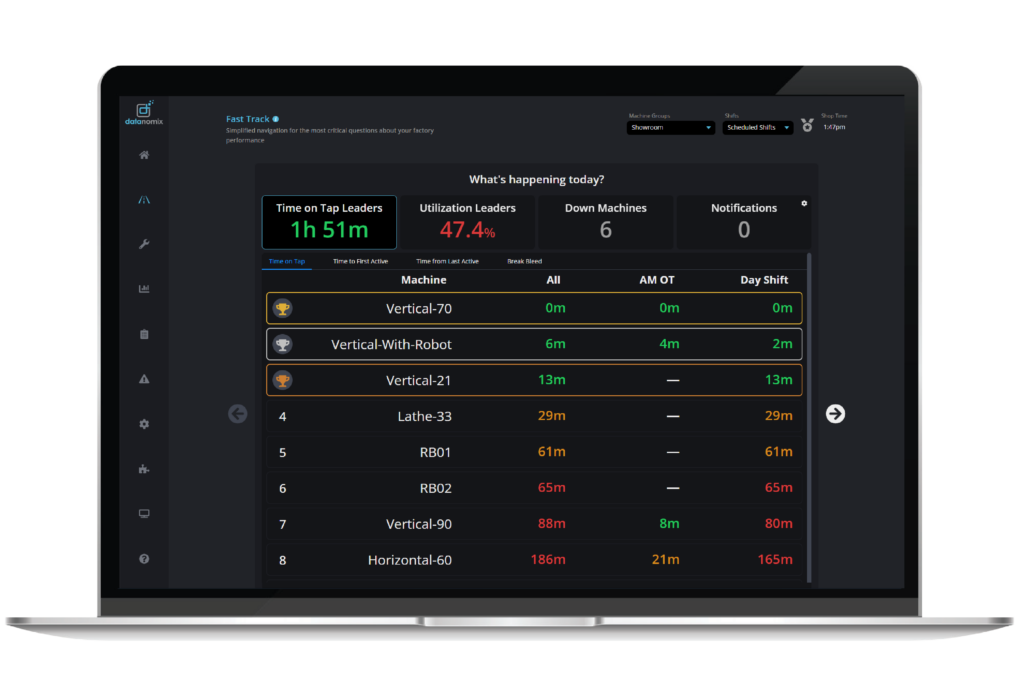
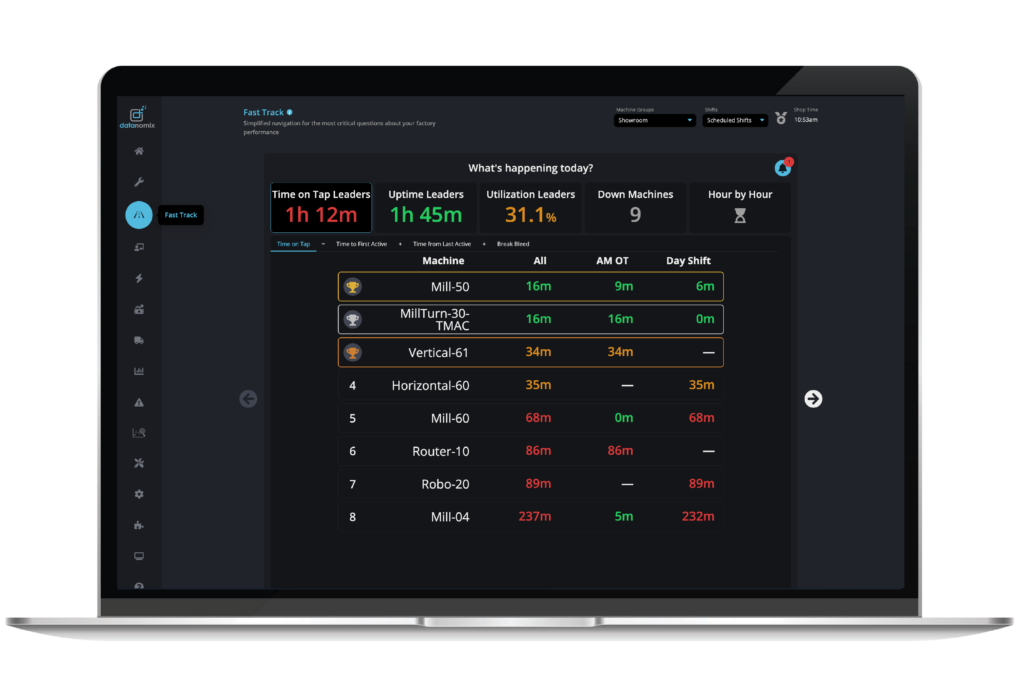
Use Time to First Active and Common Waste™ to hit the ground running every shift. Know how quickly machines get cutting—and where hours are being lost.
Keep Cutting
▼
Stay in cycle with the Stopped Machines Hot List, a live TV view that calls out machines that need attention. Increase runtime, reduce idle, and keep parts moving.
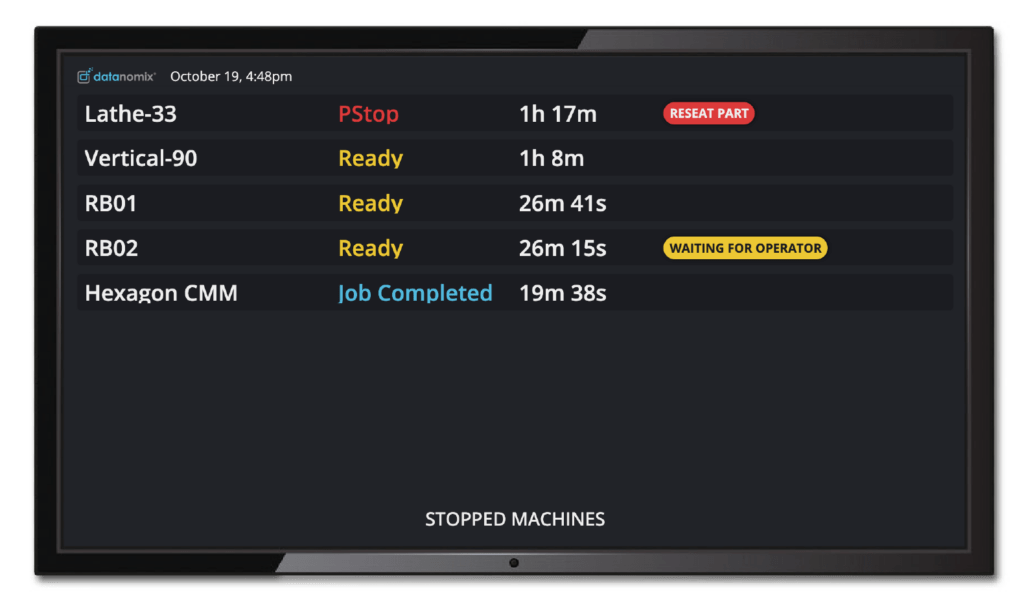
See what’s down and what it needs to get back up and running
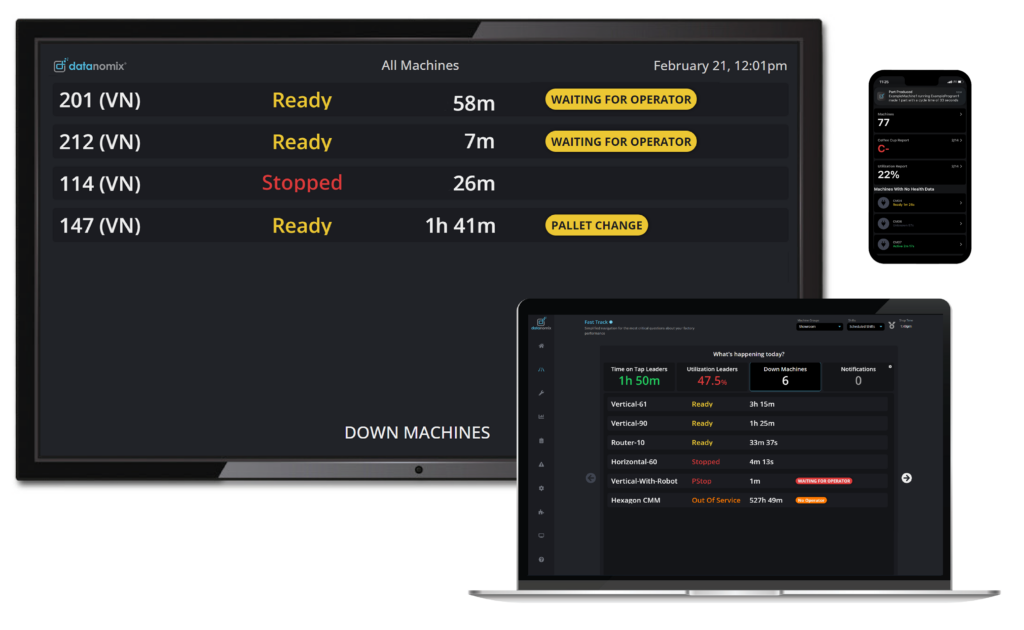
Drive Efficiency with real-time production monitoring performance across all devices.
Datanomix TV Mode for Real-Time Production Performance on the Shop Floor
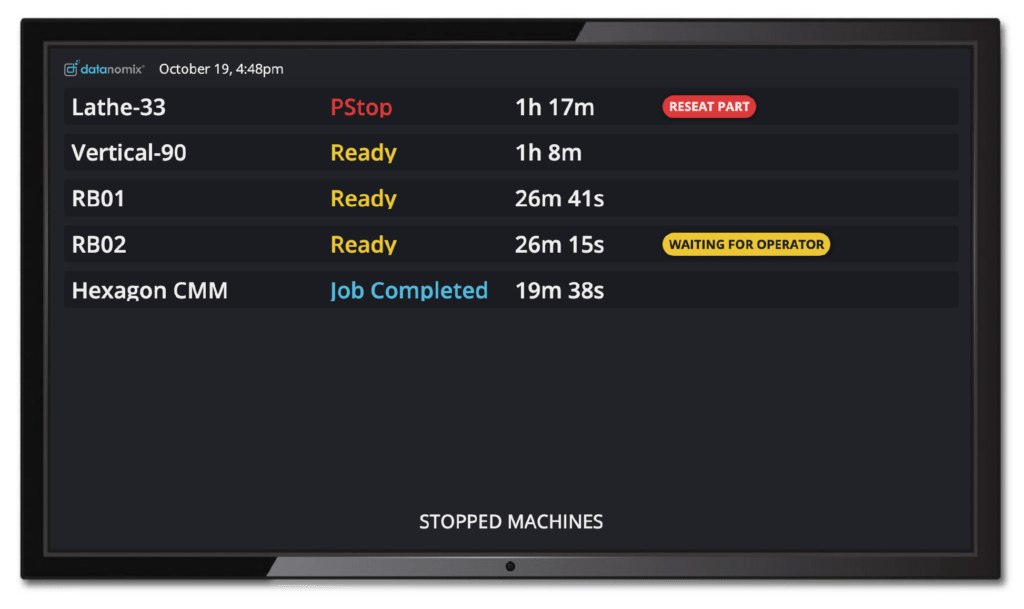
What’s stopped and what does it need to get running again?
Operationalize the Wins with Purpose-Built Playbooks
Datanomix organizes product capabilities into purpose-built Playbooks, so you’re not lost in data; you’re locked onto outcomes.
We coach through Playbook Workflows that ensure your team turns insight into action and gets better every day.
Connects to All Major Makes and Models of CNC Machines, Fabrication Equipment, & More
Built for Any Shop. Proven in Every Industry.
Whether you’re a high-mix job shop or a high-volume OEM, Datanomix delivers the visibility manufacturers need to drive more output, boost margins, and make winning decisions.


Hundreds of shops are already seeing the impact. Real results. Real momentum. And a growing community of manufacturers committed to Making More.


The Datanomix Difference: What Makes It Work?
It’s not just what you see. It’s how fast you see it, how clearly it shows up, and how easily your team acts on it.
- Machine and data connectivity, handled by us
- Data that makes sense on day one (not month three)
- No Operator Input™ — zero burden on your team for data entry
- Playbooks built around how your shop actually runs
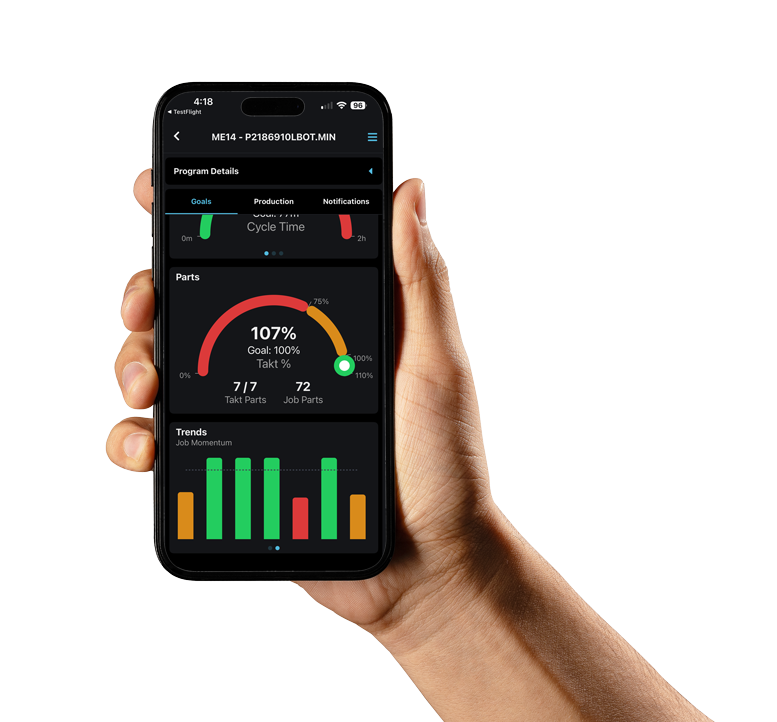
- Your shop floor in your pocket with the Mobile App
- Connect any ERP and unlock ERP Insights
- Kick-Ass Coaching that walks the shop floor with your team and keeps you winning
- Partnerships and integrations with the tools you already use
- The Datanomix Community built on real relationships and real wins
- Mountains of success stories from manufacturers just like you
- A Pilot Program that proves it before you commit
“Datanomix gives us the precision performance data we need to improve operations for our team, support our growth, and deliver a better experience for our customers.”
Tim Walls, President
Pazmac | Langley Township, BC
Datanomix Production Monitoring FAQs
- Why does Datanomix not rely on reason codes?
With Datanomix, there is no reason for reason codes.
“The underlying assumption is that reason codes are necessary because the software doesn’t understand how a job is supposed to run and, therefore, cannot possibly tell you whether something is running well or poorly. However, Datanomix has developed an adaptive algorithm that establishes a standard for optimal performance across various metrics, such as cutting time, probing time, touch time, and the number of planned stoppages per cycle, among others. Through G-code analytics, we can determine the cause of each stoppage and the expected duration for each event. Once you have these elements of job performance, you fully understand your process capability without putting any additional burden on your operators.”—Greg McHale, Founder & CEO, Datanomix
- Can you monitor older machines?
Sure, we can monitor older machines—the real question is do you need to monitor them? We will work with you to determine what’s best for your shop.
- Measure uptime and downtime with an amp clamp
- Depending on the model, some cycle time data might be available too.
- How does your scoring system work?
By running just a few parts, Datanomix creates performance benchmarks for every job you run. Benchmarks are based on your best performance for every part and evolve over time, providing a stretch goal for future runs of that part. The benchmarks are also used to create a production score—from A plus to C minus—for every job.
Production scores for every job are displayed on smart TVs on the shop floor. This easy-to-understand score shows your entire team—in real-time—which jobs are on track and which jobs need attention. Different shifts know how they are performing in relation to your benchmarks and to other shifts, giving everyone an incentive to achieve.
- How does your software get the benchmark for cycle time? Does someone need to enter a benchmark for every job?
This is one of the things that makes us unique—we don’t require operator input for anything. Our software automatically figures out benchmarks for cycle time, parts/hr and utilization just by doing statistical analysis on the data coming from your machines.
- What’s involved in getting the system setup?
We typically need WiFi network information and can take it from there. We plug a device into your CNC machines, which sit on the WiFi network and collect real-time data. We handle 100% of the Installation, implementation, and rollout plan.
- What equipment do you connect to and what data do you collect?
Datanomix connects to CNC and legacy machines to collect real-time data like cycle time, part count, machine state, alarms, and tooling info.
CNC Equipment (Ethernet or Wireless)
- Part Number
- Cycle Time
- Part Count
- Machine State
- Alarms
- Operator Messages
- Macro Variables
- Tooling Data
- G-Code Program + Comments
- Machine sensor data (loads, feedrates, spindle rpm, etc)
Legacy Equipment (Serial Port)
- Part Number
- Cycle Time
- Part Count
- Machine State
- Macro Variables
Legacy Equipment (IoT Sensors)
- Cycle Time
- Part Count
- Machine State
- Manual Inputs
Legacy Equipment (Current Draw)
- Machine State
- How many users does your licensing include?
Our pricing is per machine per year, not per user. You can have as many user accounts as you’d like.
- Can this data integrate with my ERP system?Absolutely. While ERP integration isn’t required to use Datanomix, our Universal ERP Connector makes it easy to connect with your existing system. We securely pull key data—target cycle times, setup times, scrap counts, part quantities, and due dates—helping drive accurate OEE and real-time insights. Our integrations are designed to be fast and flexible, requiring minimal IT effort.
ROI Calculator
How much more could your shop be making with Datanomix?
