Drive Growth
Advanced Analytics to Support and Guide Continuous Improvement
MAKE MORE PROGRESS
If your shop has reached a high level of production performance, it can be difficult to find opportunities to grow without hiring more people or buying more machines. Having accurate real-time and historical data provides the edge you need to support your internal processes and maximize your continuous improvement efforts. With Datanomix, you’ll have the ability to go really granular and dig into data to uncover those hidden opportunities.
Get immediate answers to important questions…
- How are my investments in people, machines and automation hitting my KPIs?
- Where should we invest to get the best ROI?
- What tool is causing the most downtime? Can we change tools—or vendors?
- How can we use Production Monitoring data to build the company culture we need?
- What machines were put into manual mode? When? Is there a pattern?
We’ve got your back every step of the way!
Change is hard, even when the software is as easy to use as ours. When you partner with us, you get a dedicated Customer Success Team that works with you to customize the three phases of the rollout and the associated training.
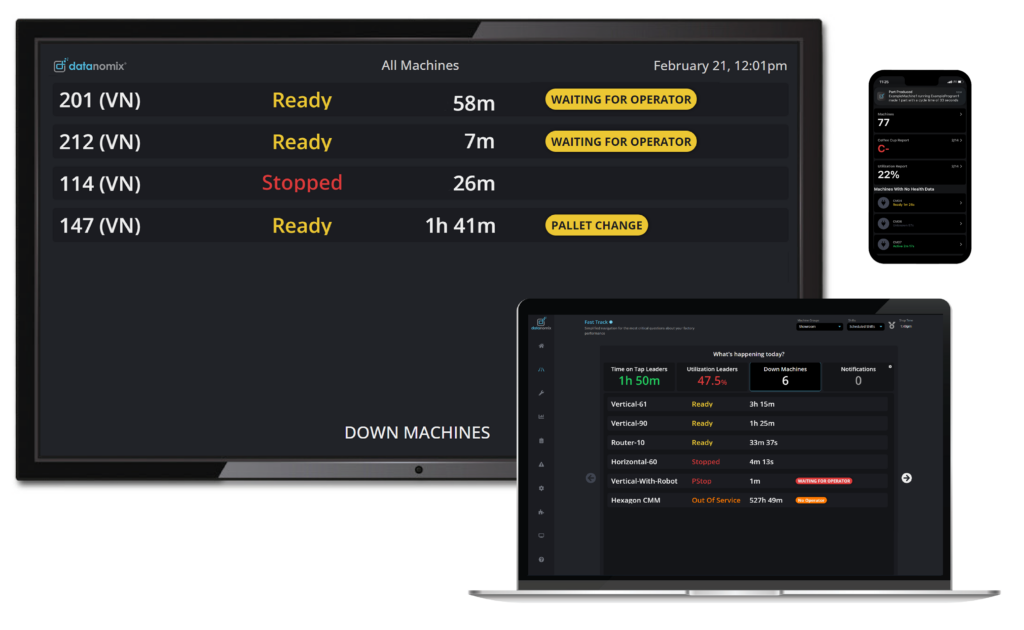
PHASE 1: QUICK WINS
Every new customer starts out with three Quick Win workflows. These deceptively simple first steps get every employee engaged with using real-time data and have an immediate impact on efficiency.
1. Down Machines
TVs display every stopped machine, why it’s stopped, and for how long.
2. Real-Time Notifications
Alerts sent to mobile devices that show operators & supervisors where their attention is needed.
3. Time On Tap
Tracks and displays the time it takes to get every machine into cycle across every shift.
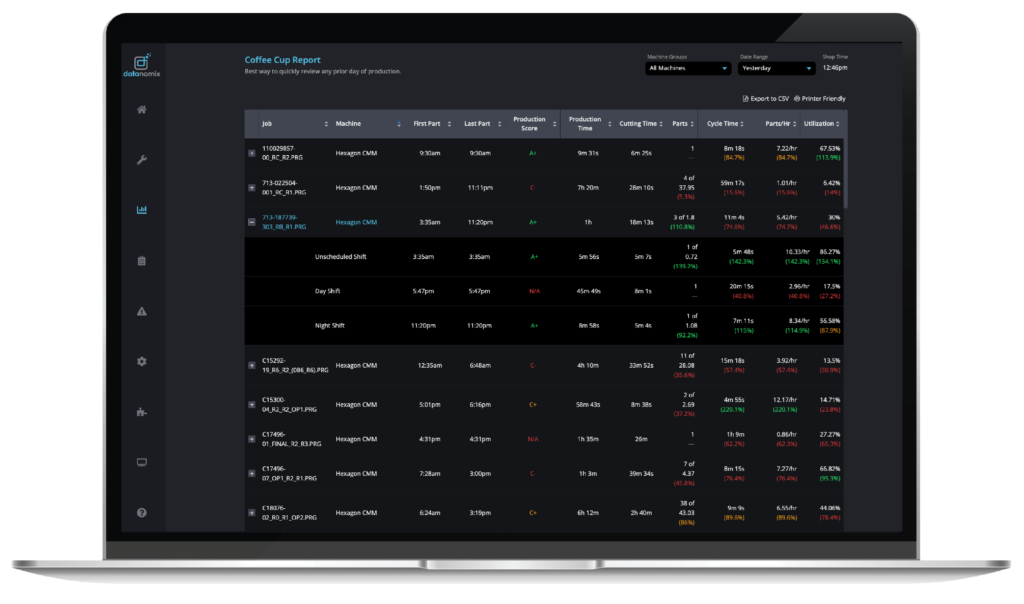
See How Every Facility and Every Part is Doing with the Datanomix Coffee Cup Report
Every morning at 6 a.m., an automated report called the Coffee Cup Report is emailed to the team. It is a simple scorecard of end-of-day and end-of-shift performance by job. The report provides the data needed to run an informative morning production meeting and quickly update the leadership team on the previous day’s work.
PHASE 2: SETTING GOALS
After the initial bump in efficiency and establishing a new benchmark for utilization from from the Quick Wins, your dedicated Customer Success Team will meet with your managers to set goals and track deviations using:
Downtime Pareto Report
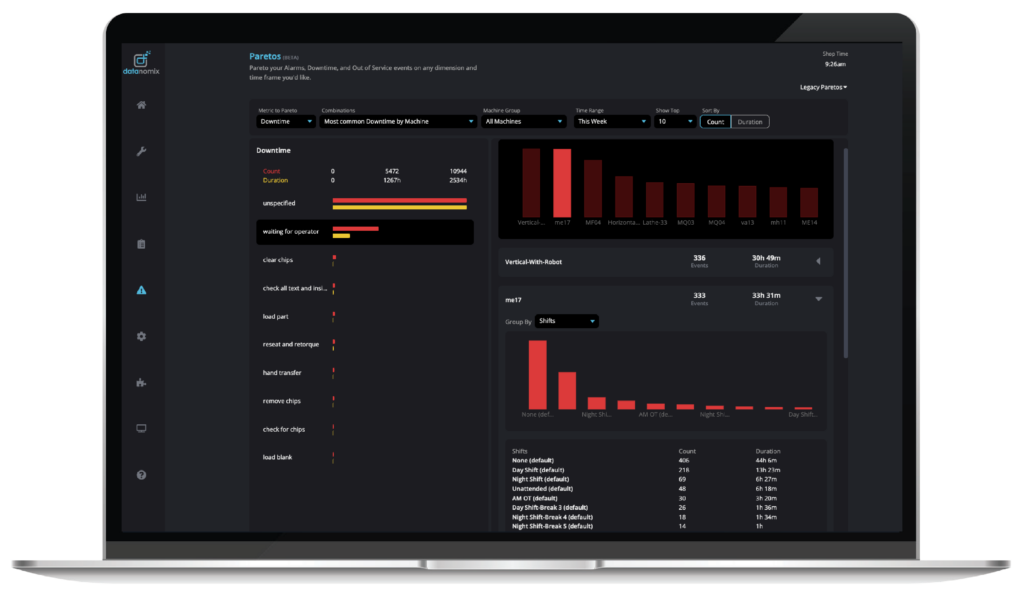
Ranks what’s causing the most downtime—alarms, program stoppages, tool changes, etc.
Capacity Report
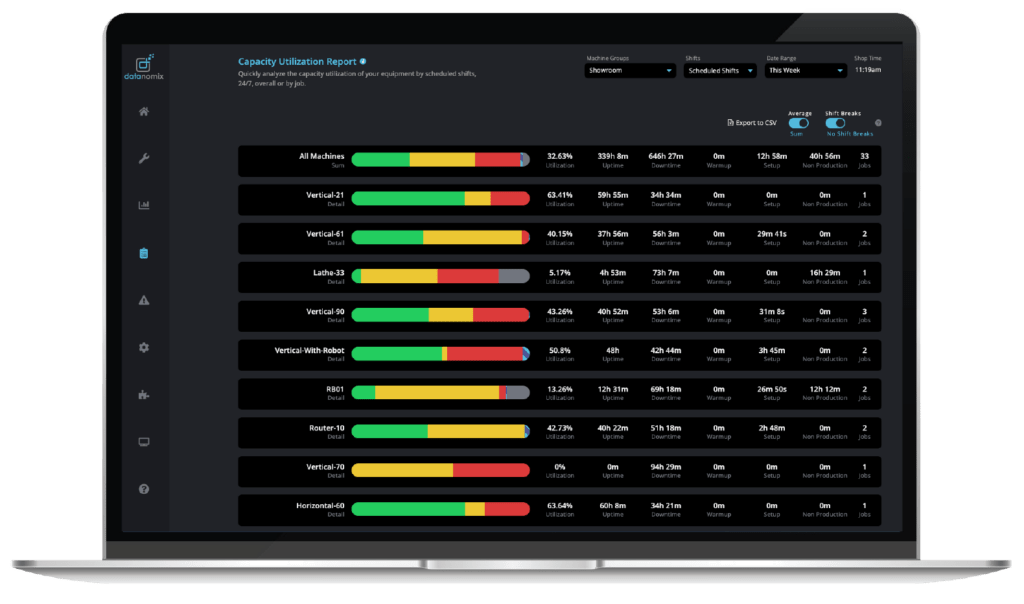
Analyzes capacity utilization by day or scheduled shifts, and then by work cell or individual machines to help you identify capacity constraints.
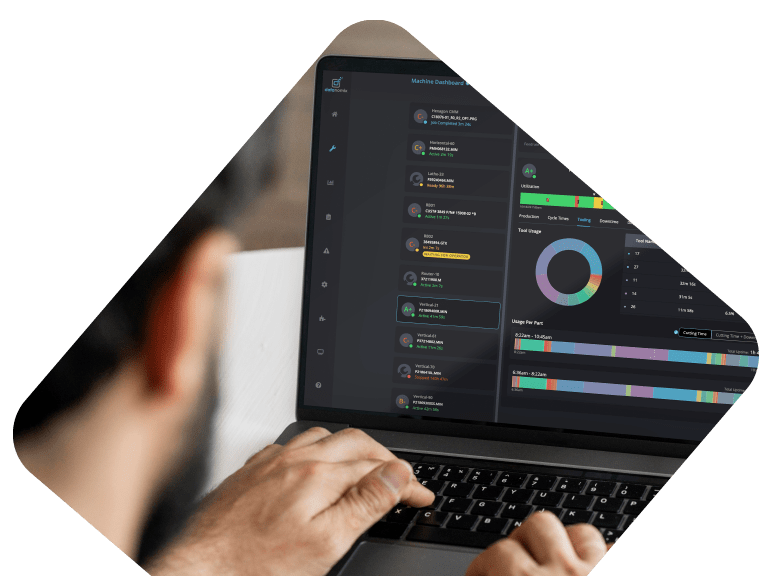
Machine Diagnostics
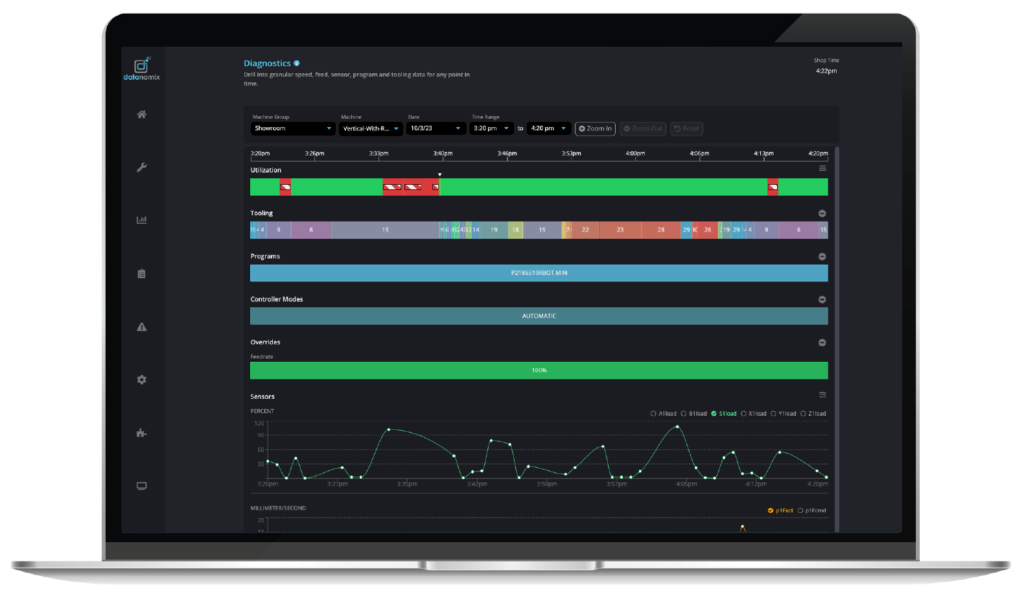
Drills into granular speed, feed, sensor, program, and tooling data for any point in time
Tool Usage Data
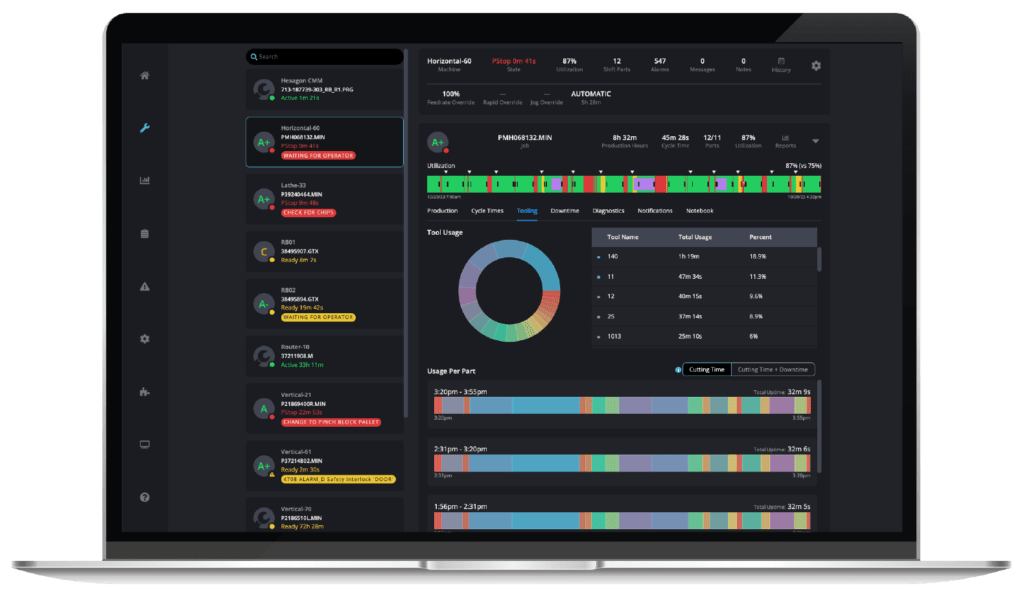
Analyzes how long each tool spends in cycle to reconcile your cutting times, both in aggregate and per tool.
PHASE 3: REPORTING & CONTINUOUS IMPROVEMENT
In the third phase of training, your shop’s leadership team will learn how to track KPIs, validate improvements, and identify risks and opportunities to profitability goals. To ensure ongoing success, customers always get access to unlimited support, software updates, and online training.
ROI Hub
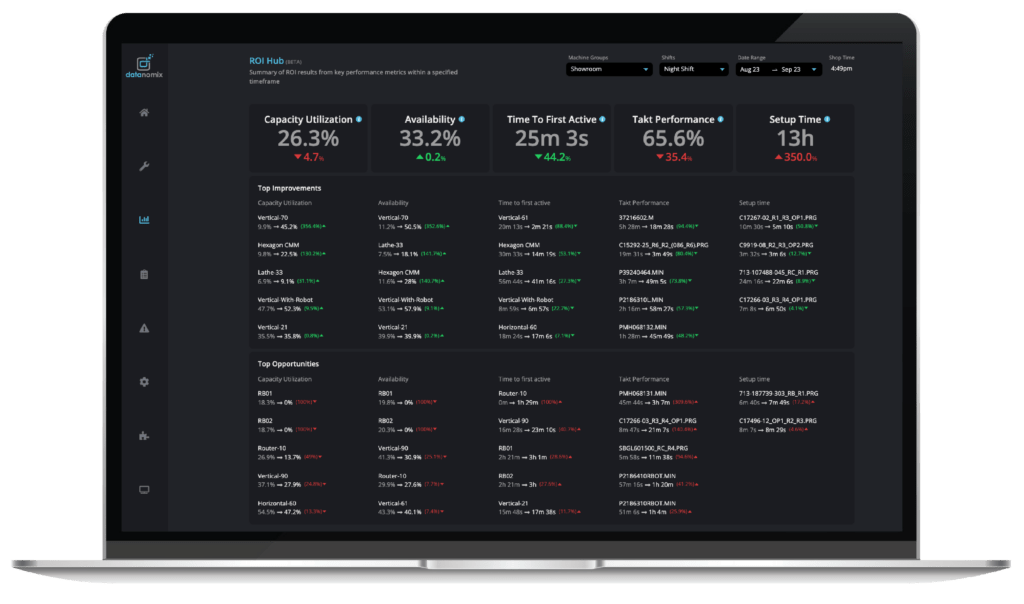
Summarizes the return on investment (ROI) results from key performance metrics within a specified timeframe.
Quote Calibration
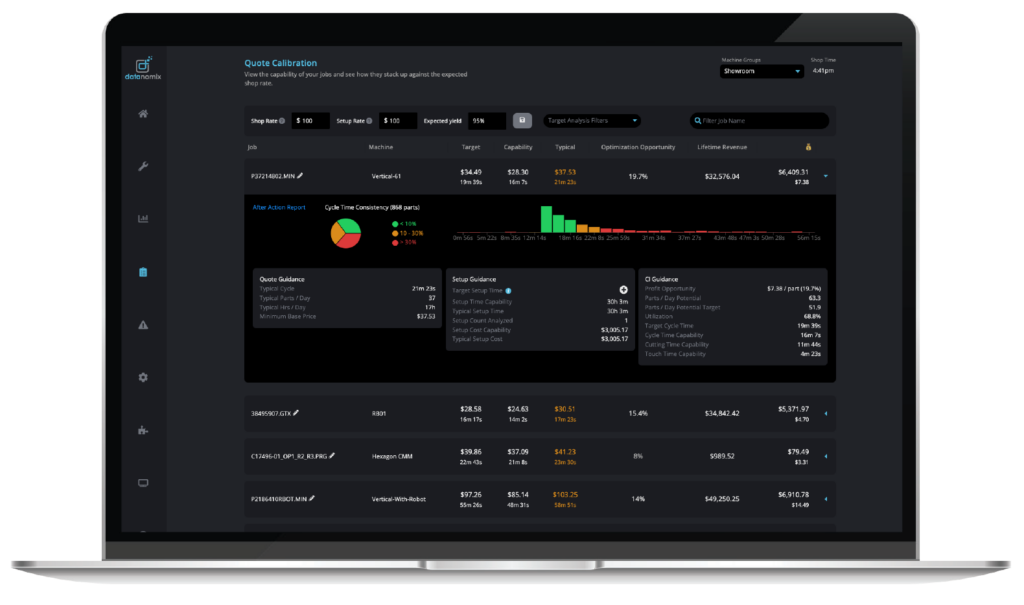
Shows the capability of your jobs and how they stack up against the expected shop rate.
After Action Report
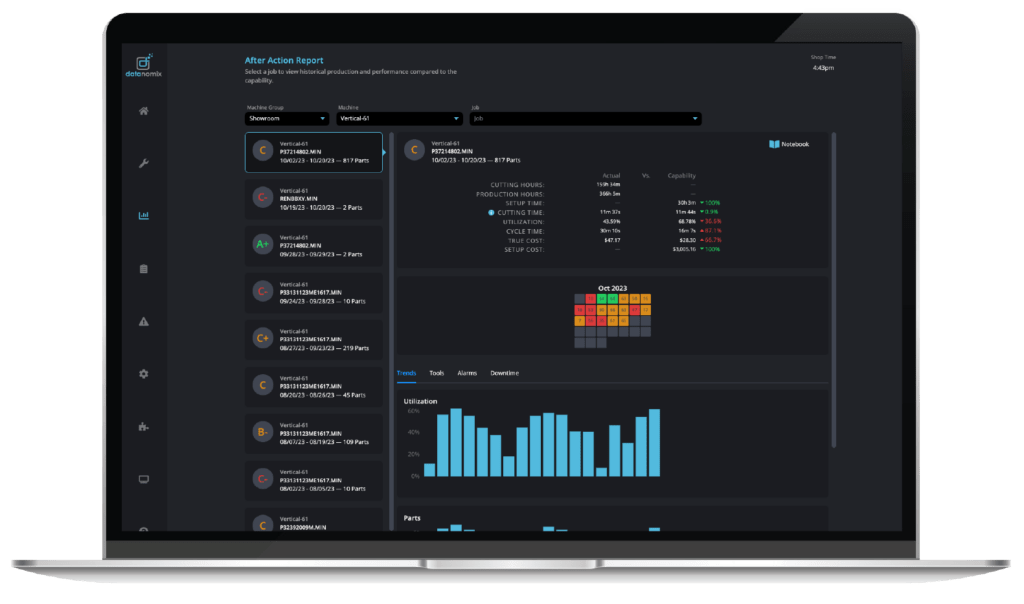
Shows historical production and performance by job, compared to the capability.

“ I use Datanomix reports in our planning and operations meeting to support critical decisions.“
—Jesse Bunnell, Plant Operations Manager | Newfield, NH
Do You Want More?
Unlock productivity, streamline operations, and energize growth.
Request a demo today.