2023 Datanomix Product Release Highlights
One of the core strengths of Datanomix is delivering rapid customer-driven innovation. For example, in 2023, we delivered a ton of new features and functionalities that help our customers maximize their revenue and profitability—without adding machines or staff. Below you’ll find just some highlights from our 2023 product releases:

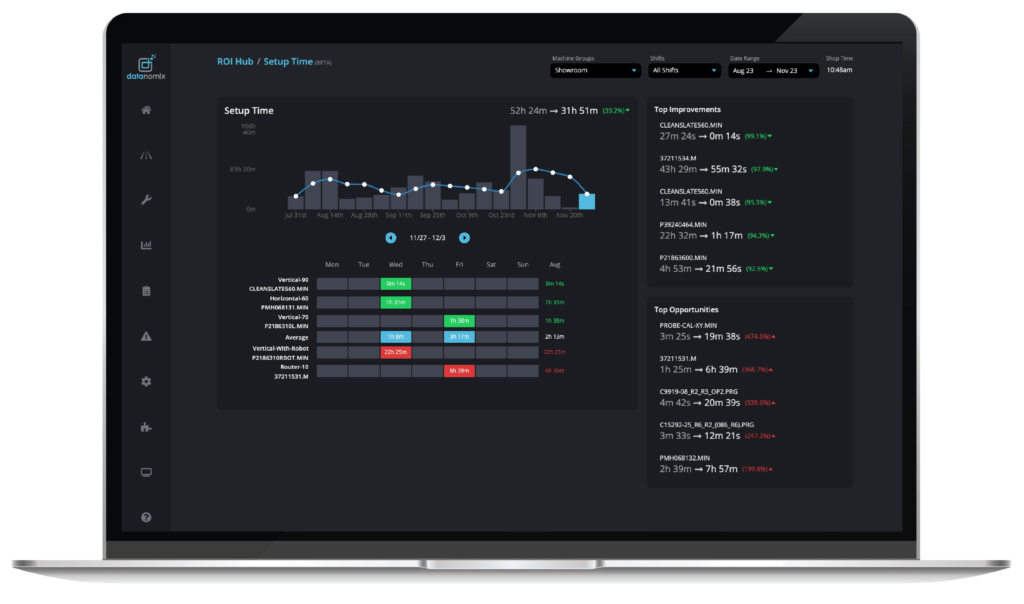
Setup Time Report
The Datanomix ROI Hub shows your setup time trends with a heatmap of setup time by machine across the selected week. Tracking and trending this identifies top opportunities to boost uptime, driving more potential revenue.
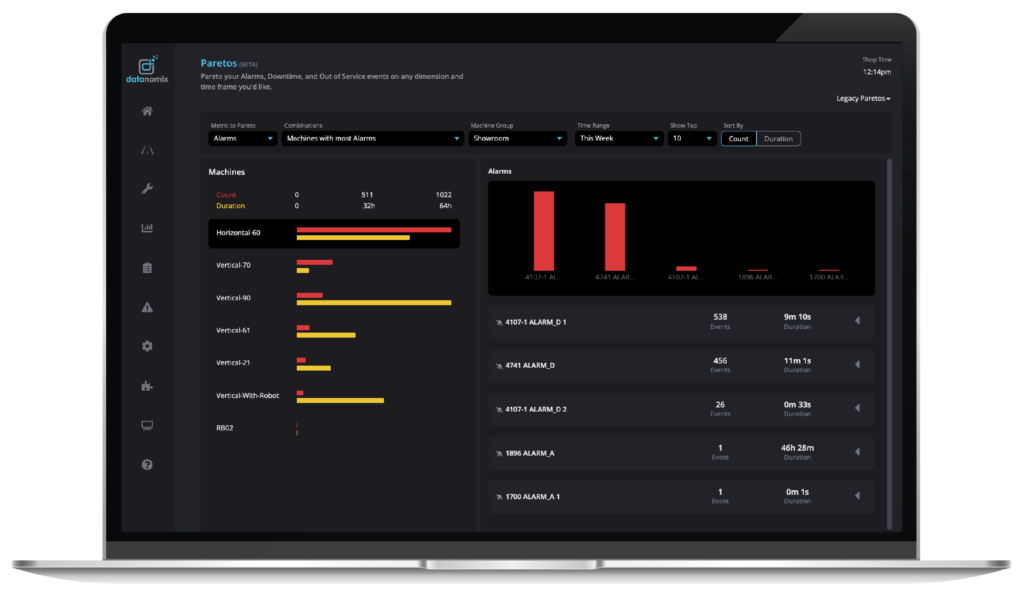
Pareto Views
See Pareto views of Alarms, Downtime, Setup Time, Changeover Time, and Maintenance events on any dimension and time frame you’d like! This new view quickly visualizes things like what machines have the most alarms, what those alarms are, and how much downtime is associated with it. It’s another way to uncover the issues that are causing the most downtime.
Takt Parts Calculation Enhancement
New and improved Takt Parts calculation adds decimal place precision to the denominator. This enables you to see how far fractionally into a part you should be as time marches on and gives you a more accurate view of your Performance %.

Unscheduled Shifts
Your “Unscheduled Shifts” span prior to, in-between, and after shifts. This additional data will appear in the Coffee Cup and After Action reports if a part is produced outside the scheduled shifts.
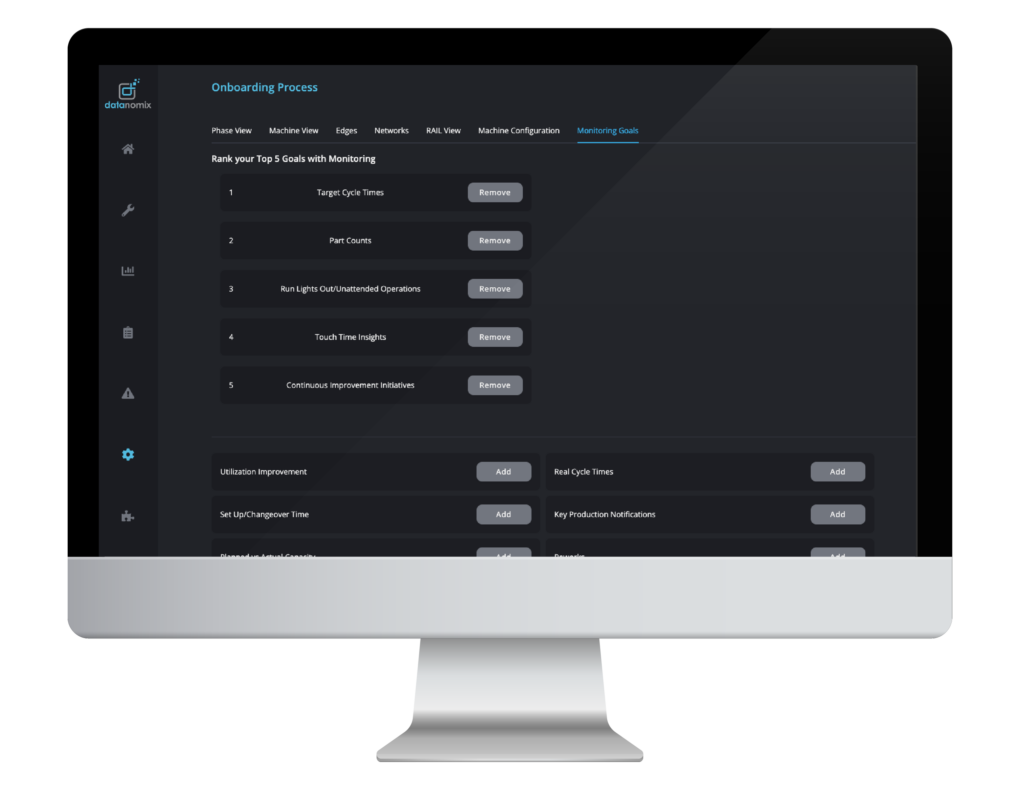
Monitoring Goals
We take onboarding very seriously. So seriously that it is built into the product and now customers can specify and rank their Top 5 monitoring goals. This helps the customer success team prioritize training.
ADI/MDI “Bubble” in TV Mode
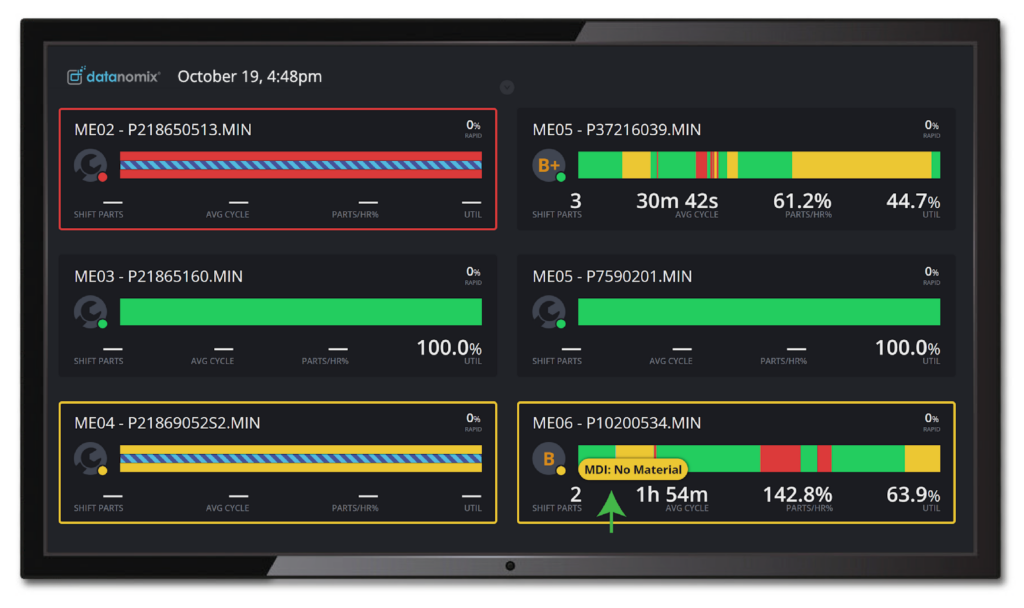
Automated Downtime Insights (ADI) and Manual Downtime Insights (MDI) now appear as a “bubble” on your shop floor TVs that display Datanomix TV Mode. This alert shows that a machine is waiting for someone to do something and why! Best part? It requires NO operator input!
Notifications for Out-of-Service Events
With the Datanomix mobile app for iOS and Android devices, customers can see the status of their Datanomix-connected machines on a smartphone or tablet to track job performance in real time. Turn on our newest push notification to know when machines enter an “Out of Service” Mode. Datanomix Notifications can be sent to supervisors and managers so they can quickly intervene when necessary.

Tool Usage Data
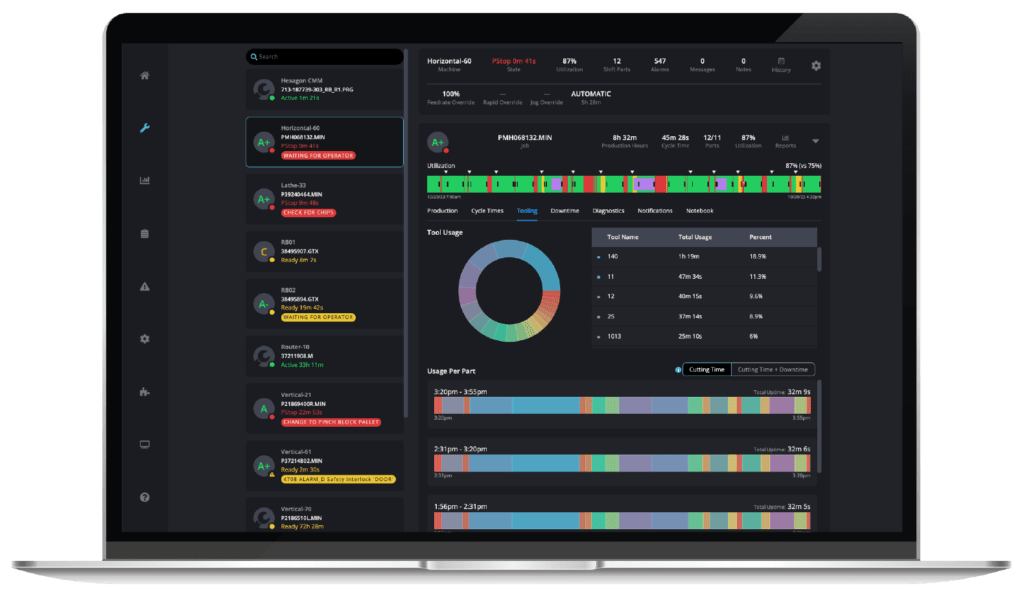
Customers can drill into Tool Usage per part and analyze how long each tool spends in cycle to reconcile cutting times, both in aggregate and per tool. The data can be viewed in 3 ways:
- Tool Usage breakdown by shift in the form of a pie chart and table.
- Toggle Tool Usage breakdown for ‘Cutting Time’ of each part.
- Toggle Tool Usage breakdown for ‘Cutting Time + Downtime’ of each part to see when you are not cutting, and what tool you get stuck on, as that can indicate challenges with a specific tool.
New Machine Diagnostics Report
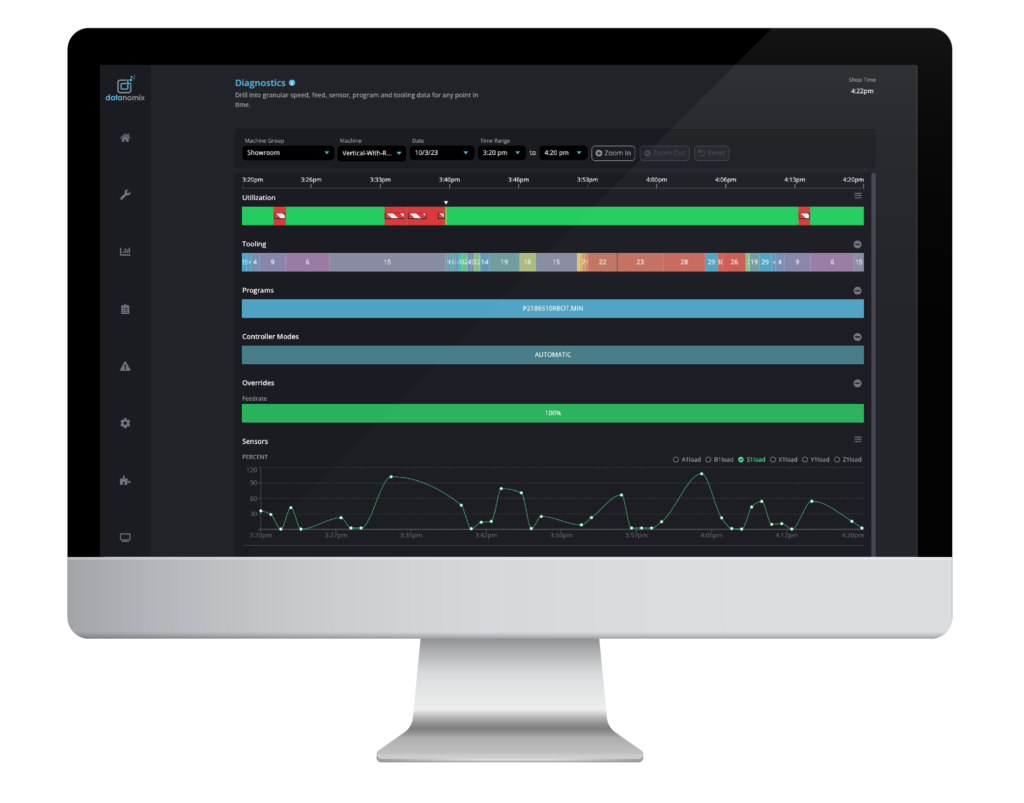
Customers focused on job performance and continuous improvement can go really granular with our new Machine Diagnostic Report. Because sometimes you want to zoom in on a particular point in time of a program, part, or machine. Use cases include:
- Evaluate feeds/speeds at points in time
- Evaluate sensor data (tool loads, spindle loads) at points in time
- See when controller modes are changed on machines
- Triage potentially strange events on a machine (i.e., crashes, when a bad part was made)
- Look at program changes throughout a day/shift/etc.
TV Mode Hot Lists
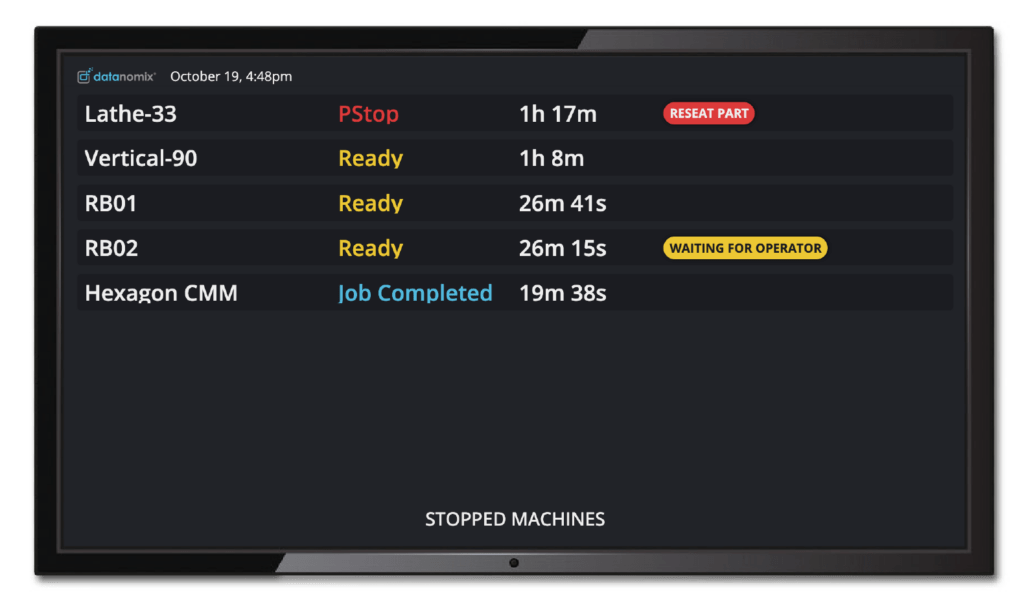
The TV Mode slideshow now includes Hot Lists to give you a quick view into a set of machines that need attention. This feature shows which machines are stopped and why so you can reduce touch times and improve production hours. With TV Mode Hot Lists, you’ll quickly identify answers to your questions around
- Which machines are down? And for how long?
- Which machines take too long to warm up at the start of the day?
- Which machines are in setup, and for how long?
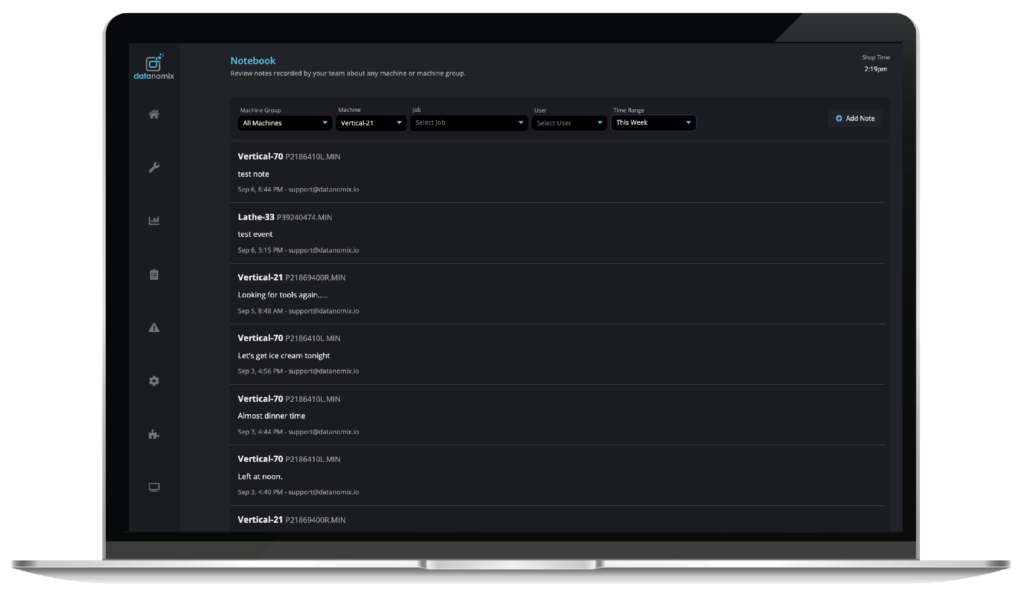
Datanomix Notebooks
Notebooks provide a tool for your operators, team leads, or managers to share knowledge across your team. Datanomix Notebooks centralize those notes into an easy-to-read format, because trying to read people’s handwriting is no fun. They are available throughout the product and capture how production is progressing, what an operator struggled with, what the next shift should be aware of for the job they’re running, and more! Replace that dirty old notebook next to a machine filled with unreadable handwriting.

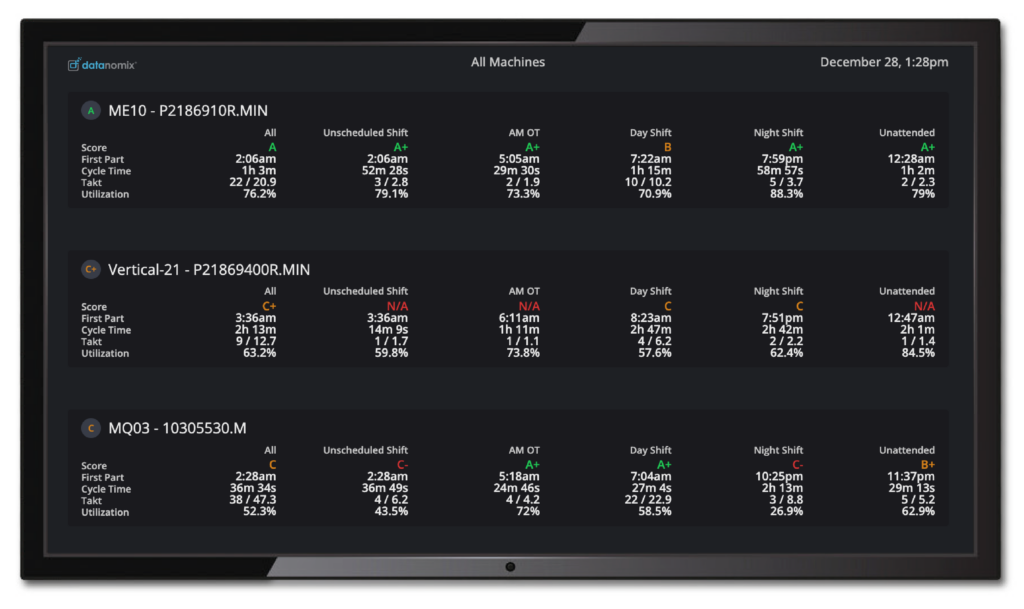
See Yesterday’s Coffee Cup Report on TV Mode
The Datanomix TV Mode slideshow now includes yesterday’s coffee cup report to give you a quick view into yesterday’s shop performance.
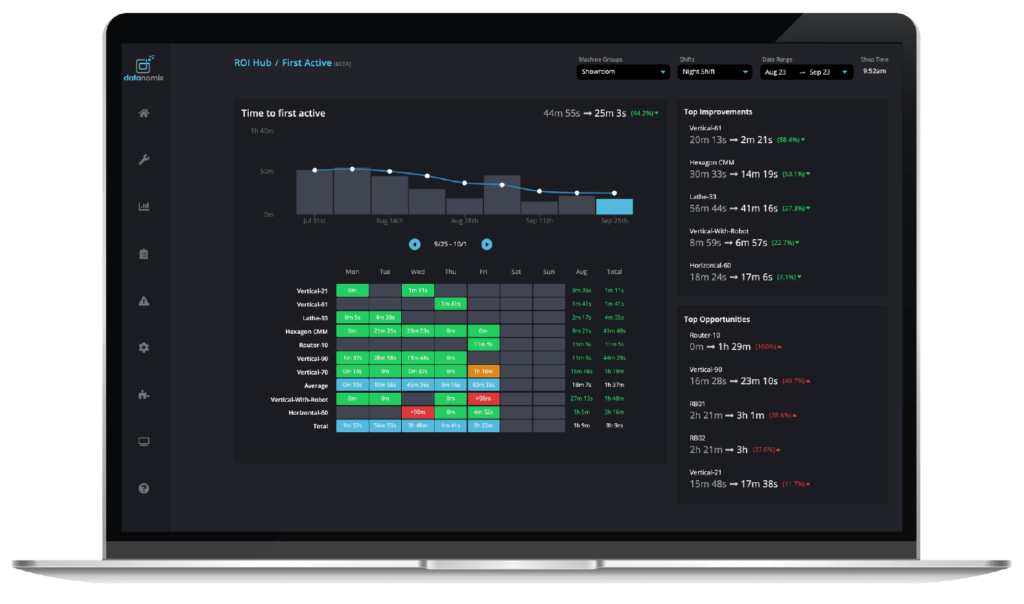
Analyze Time To First Active (TTFA) in the ROI Hub.
Time to first active is the time it takes every machine to get into cycle at the start of every shift. It is frequently a place where time can be reclaimed. We total the TTFA in the ROI Hub:
- By machine (total time lost per week on each machine)
- By day (total time lost per day on all machines)
- The whole table (total time lost per week to not getting started right away)
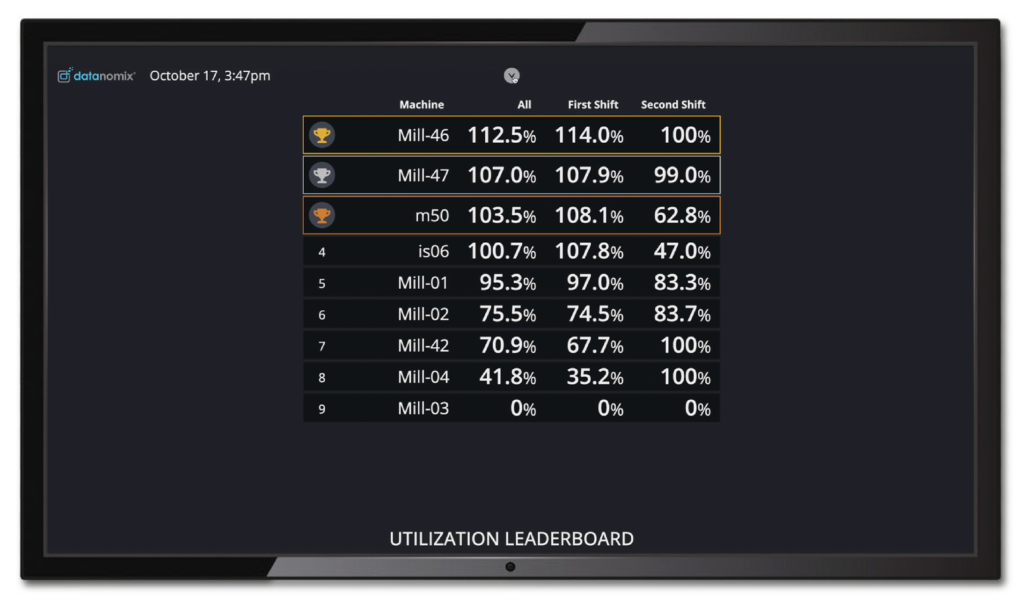
TV Mode Leaderboards
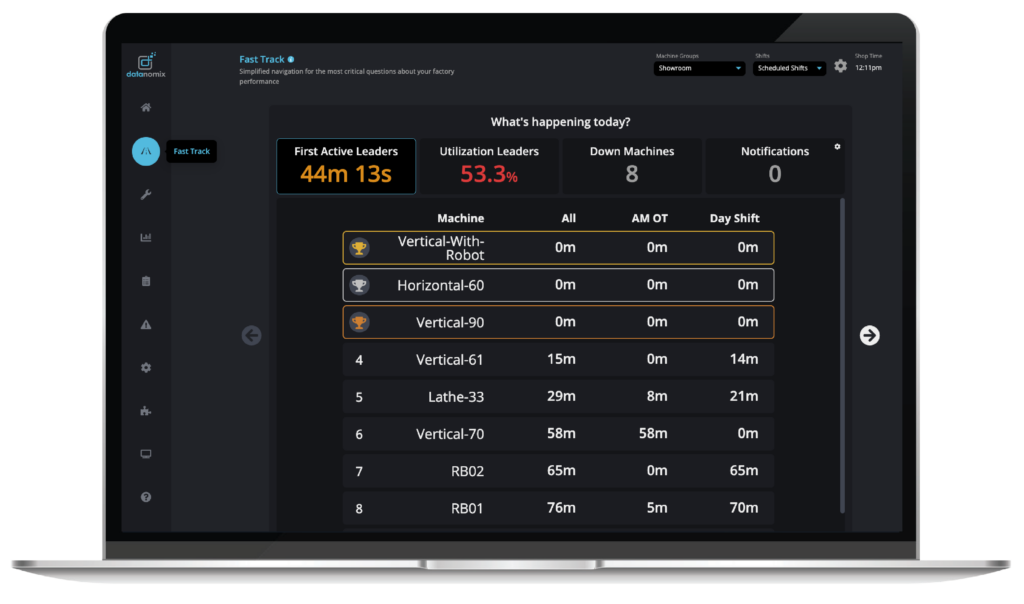
See which machines grabbed the top spots with Time To First Active and Utilization Leaderboards overall and by shift. Gold, silver, and bronze trophies identify top performers!
Fast Track Mode
We ended the year strong with a major product release that provides one-click navigation to help answer the following 3 questions:
- What is happening today?
- What happened yesterday?
- How are we trending?
Imagine what cool things we will come up with in 2024!
See for Yourself
Interested in learning more details about Datanomix Automated Production Monitoring Software? Contact us today:
