Setting Your Sights on Efficiency
How do you monitor and measure LIVE production performance to ensure you are running as efficiently as possible? Paper travelers, manual data gathering, and ERP systems only show what’s happened in the past. You need visibility into what’s happening right NOW to maximize efficiency.
Measuring Efficiency
Based on estimates, ERP systems set goals for the number of parts to be produced each shift. Your operators clock in and out and report on parts produced. If the number of parts equals the plan, then it may look like you have 100% labor efficiency. Looking at efficiency this way means that adding more machines or people is the only way to grow. But the reality is, it’s not.

What happens when you don’t meet your production numbers? How do you figure out what went wrong? Or better yet, how can you intervene when issues arise to keep jobs on track? And how do you know if the utilization numbers you use to calculate pricing and profits accurately reflect what your shop is capable of?
“With Datanomix, you know your capacity and can tell what your margins are. You can look back at similar products you’ve run for a new job you’re going to quote. Because we know how that job runs on our equipment, we can adjust our quote up or down depending on the market conditions. It’s an advantage!”
—Jack Russell, Owner, Rolar Products
Measuring Machine Efficiency
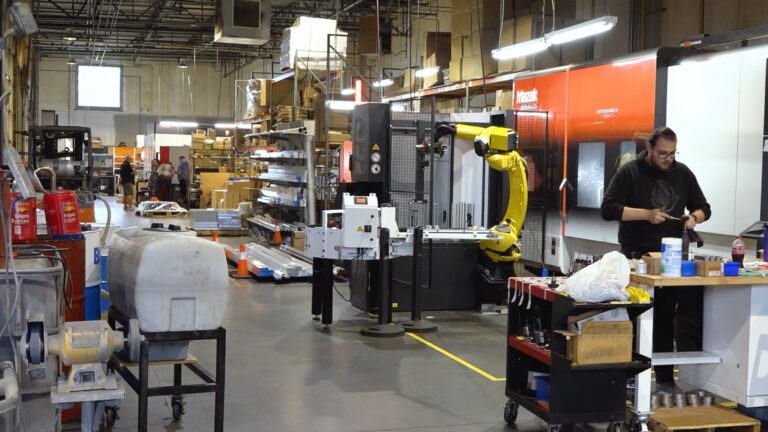
CNC machines do most of the heavy lifting, literally and figuratively, in precision machining. Looking at the efficiency of your machines will give you a much better idea of what your shop is capable of producing in a day. Here is what machine efficiency looks like:
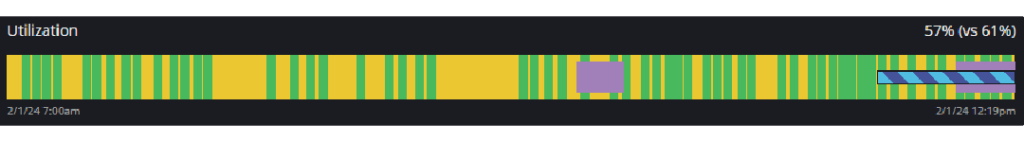
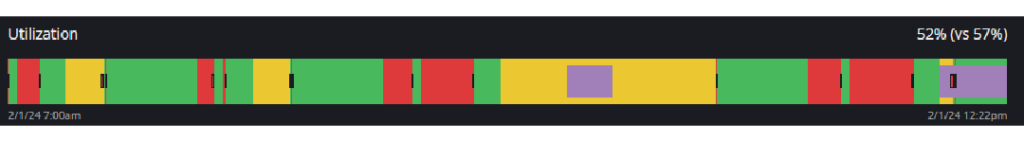
Green represents active cutting time, yellow is “waiting for operator” or touch time, and red is downtime associated with an alarm state.
These two examples of actual machine efficiency show 57% and 52% utilization—far from 100%. If your ERP estimate is 75% efficiency for your quotes, you are way off and potentially losing money on these jobs. So, what else does the data show? The top bar above represents a job making 170 parts per shift. At lunch, less than 60 have been made. Doing a manual count at lunch will give you that information. Still, real-time data would have alerted you at the first big “waiting for operator” gap, allowing the operator and/or supervisor to intervene and make the necessary adjustments to ensure the rest of the day went as planned.
The other bar shows a 1 hour and 9 minute Waiting for Operator gap (big yellow box) around the morning break (purple box inside it). It also shows wildly different downtimes for Program Stops, which are the activities that operators must do to complete the cycle, such as clearing chips, etc. Having visibility into this LIVE means that people on the floor have the information they need to perform their best and meet production targets.
Hitting Your Numbers
You have a business plan for every job, and the most critical component of meeting it is to have your machines running at the utilization rate you used to create the quote. If you’re not doing that, you’re losing money. At Datanomix, we recommend three proven ways to maximize efficiency. They focus on addressing minor issues quickly before they become big problems. We call them the Three Pilot Plays.
- Continuously broadcast to the production floor what machines are down, why, and for how long. Enables a team approach to getting machines up and running by empowering everyone to step in and clear chips, etc. when they see a machine down.
- Get supervisors and managers involved when issues are not resolved quickly. Determine the acceptable amount of downtime for various issues, then decide who needs to be notified on their mobile devices when issues exceed those thresholds.
- Track, trend, and display three key transition times during every shift:
- The time it takes to get every machine into cycle
- Downtime before and after scheduled breaks
- The time between the last finished part and the end of shift
The three plays are the foundation of Datanomix Production Monitoring. It introduces everyone in the facility to the power of real-time data and helps set a new benchmark for performance. The average customer sees an additional hour of uptime per day, per machine. Imagine how much more product you could get out the door every week, every month, every year.
Check out our ROI calculator, which shows the potential impact of implementing the three plays at your facility.
ROI Calculator
How much more could your shop be making with Datanomix?