INFOGRAPHIC: A Day in the Life of the Datanomix Visual Factory
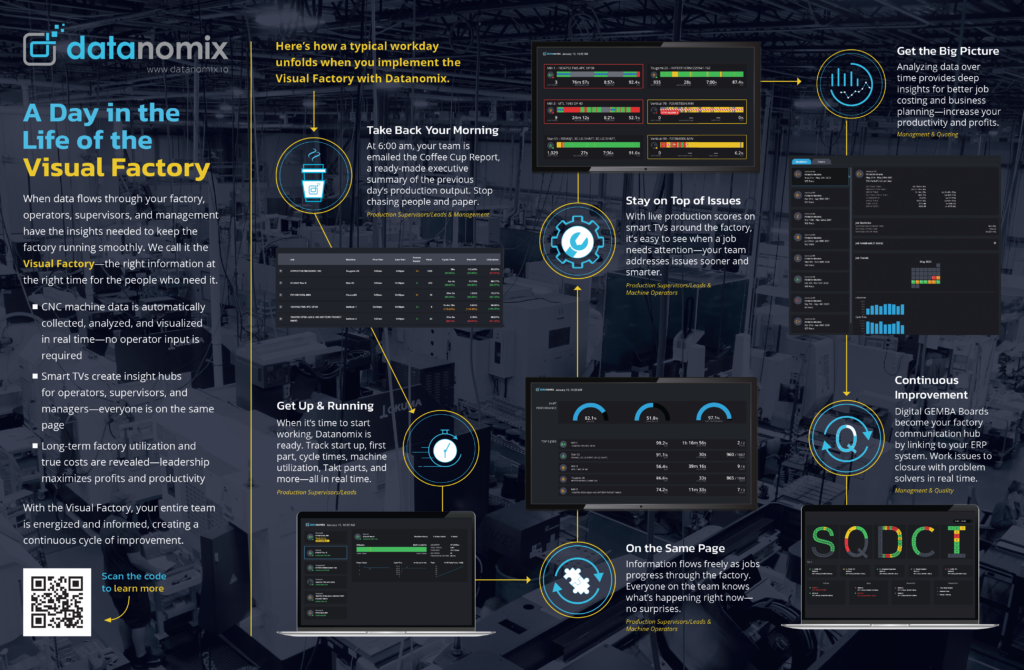
With more visibility, your entire team is energized and informed, creating a continuous cycle of improvement.
Imagine your day starting with an email containing the insights for the previous day’s production, giving you all the data needed for your production meetings without chasing people and paper for information.
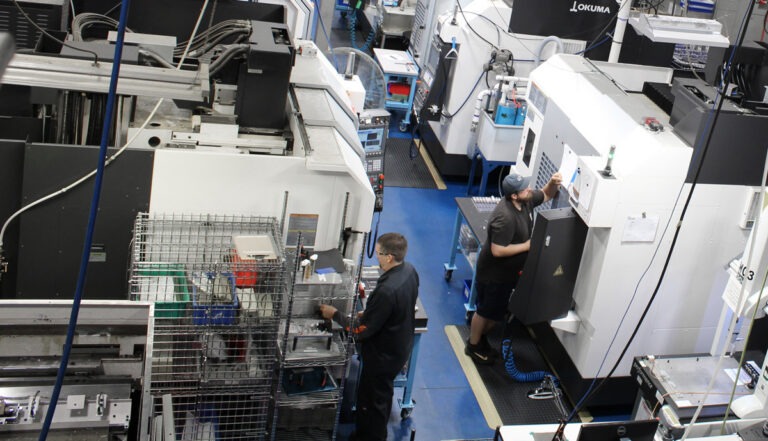
As you run parts, large-screen TVs on the floor display cycle times, machine utilization, parts per hour, and more in real-time. Production scores for every job keep everyone on the same page, so you know which jobs are on track and which need immediate attention.
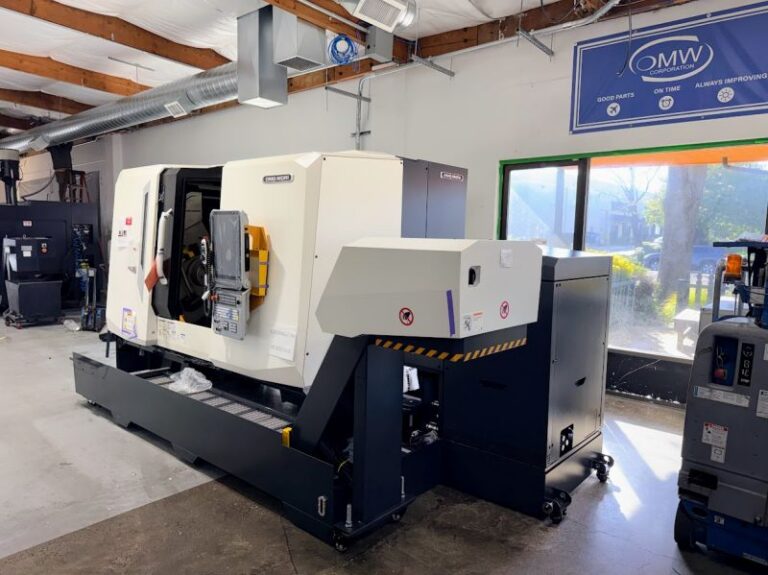
All your data is automatically saved and analyzed, providing a rich repository of insights into your overall factory performance. Standard reports display actual machine utilization and production costs, enabling more accurate quoting and informed capital planning, which helps increase productivity and profits.
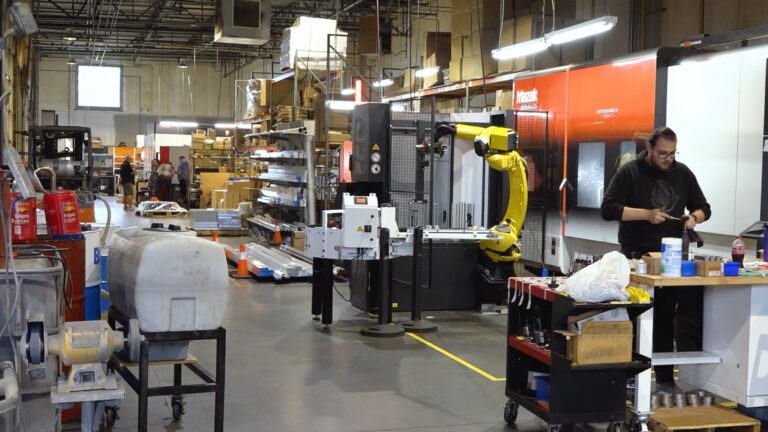
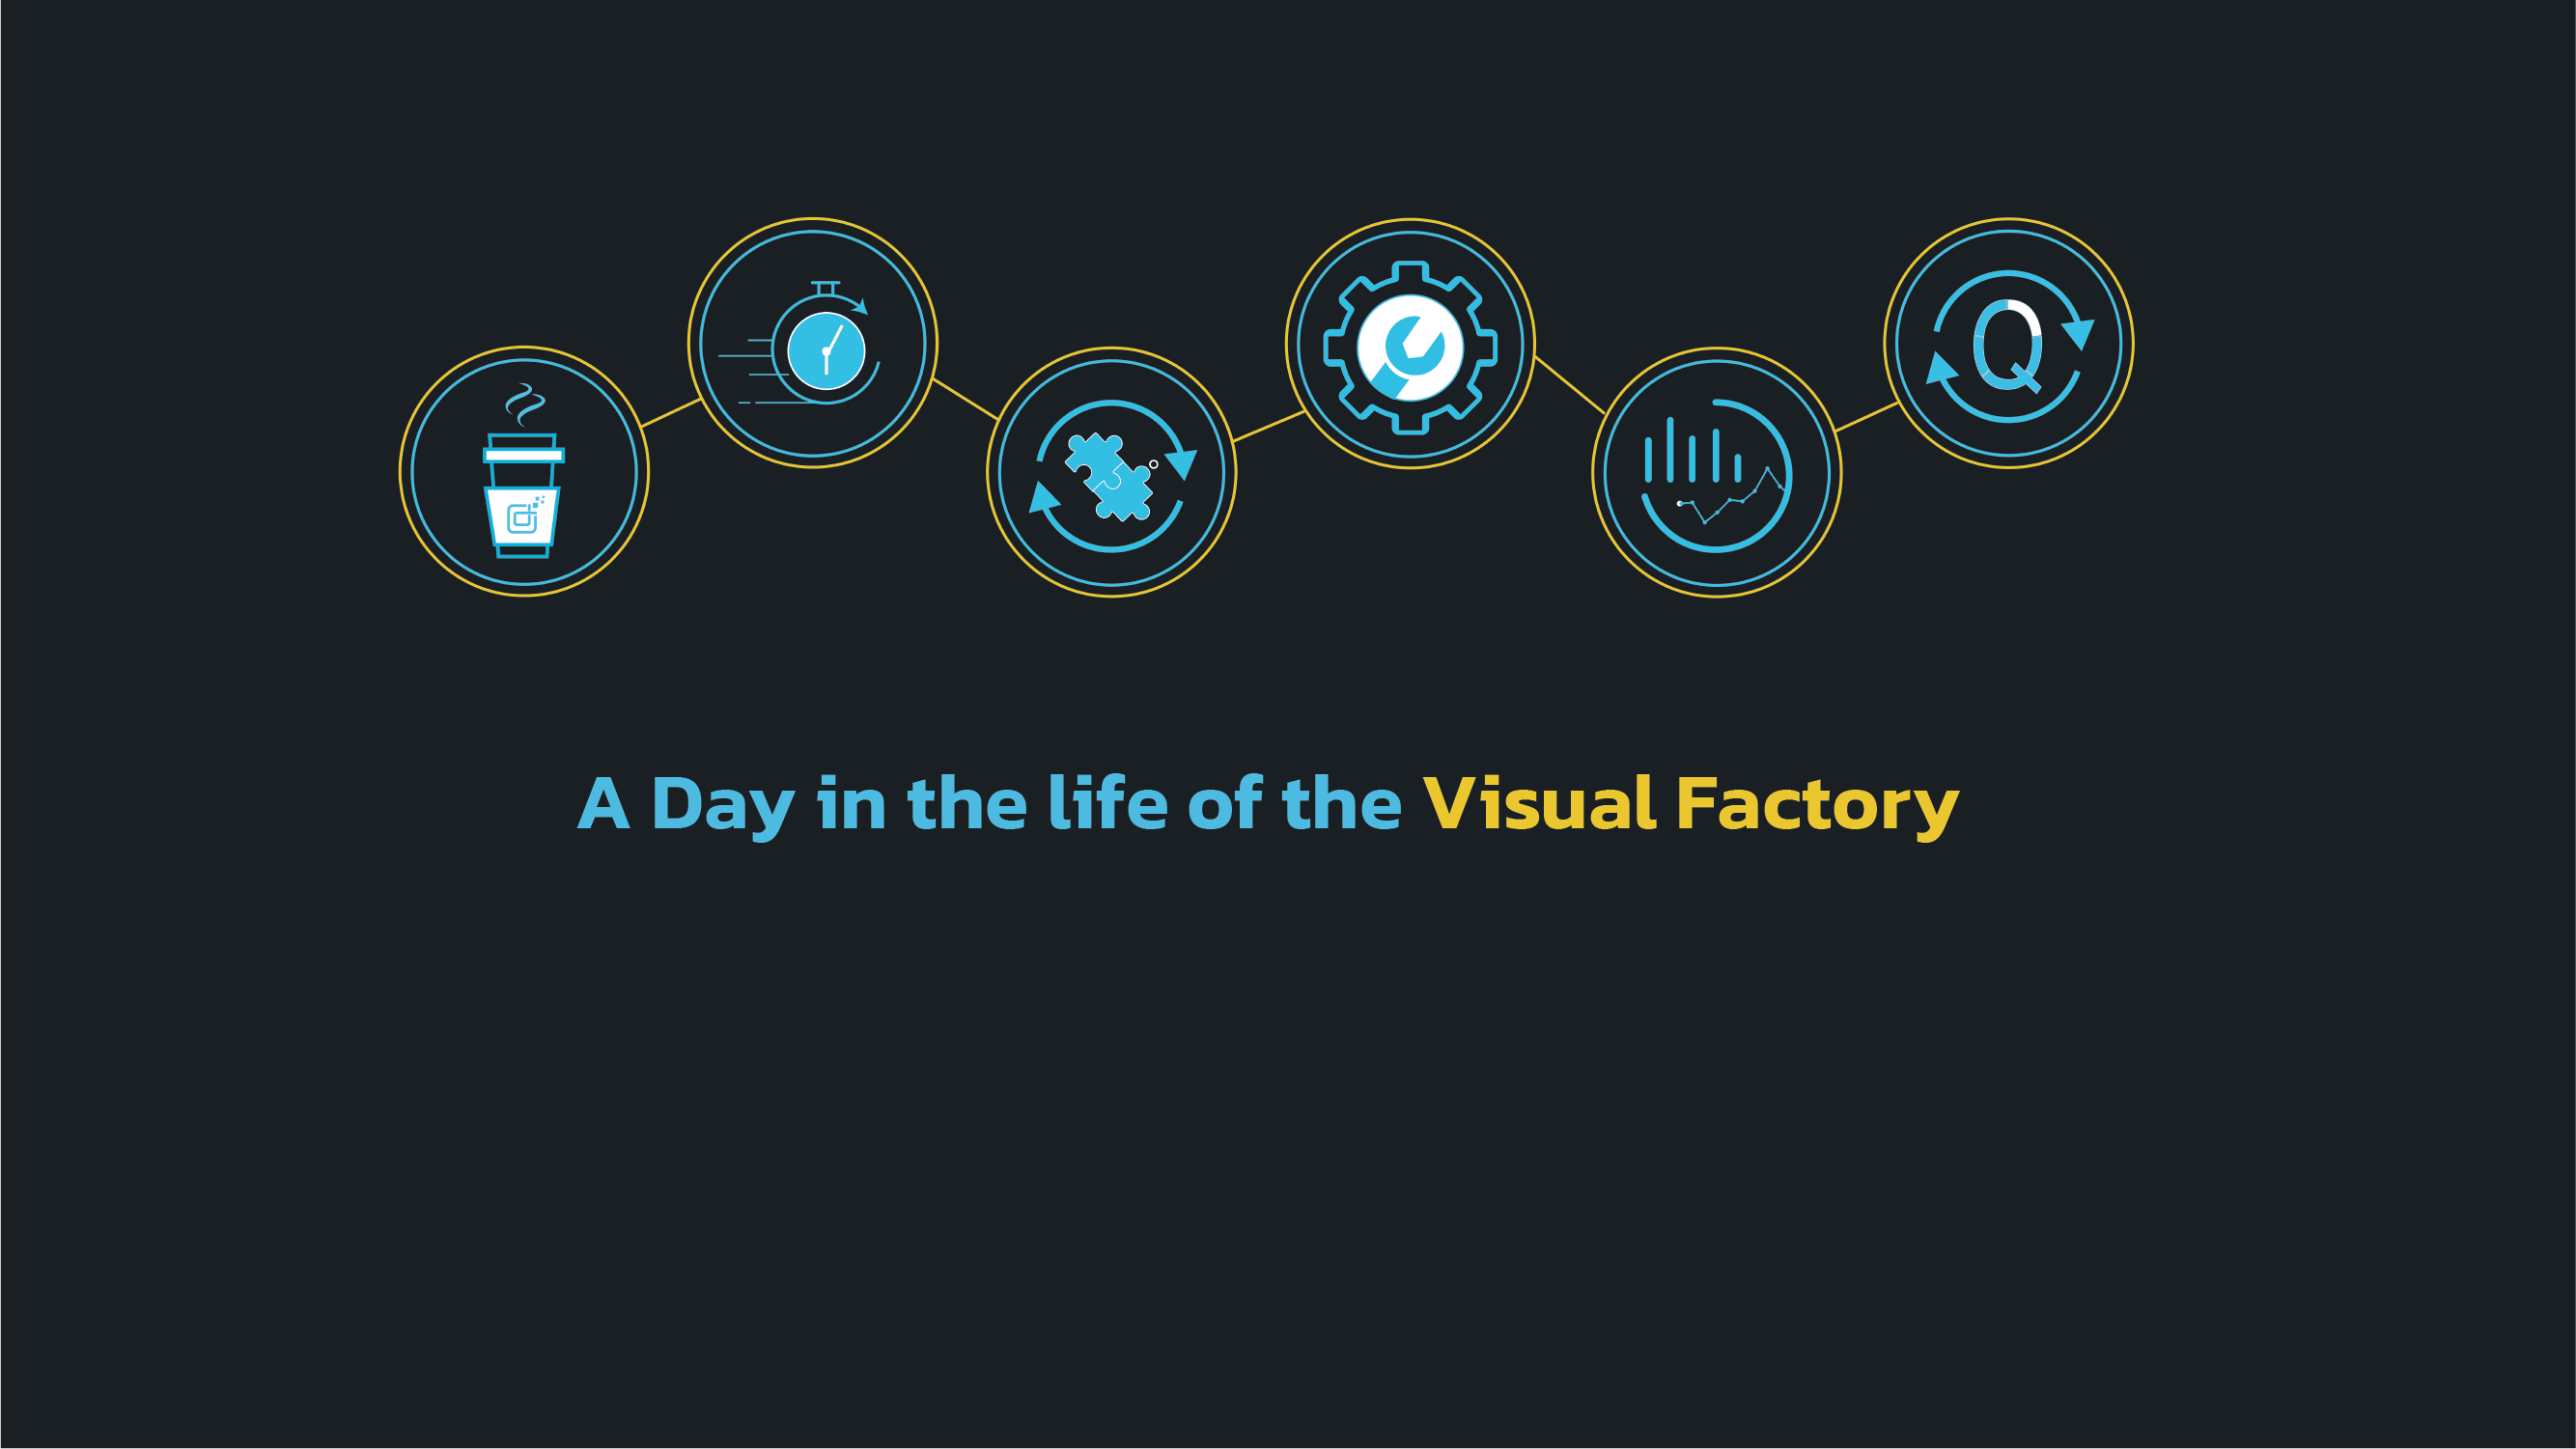
When data flows through your factory, operators, supervisors, and management have the insights needed to keep the factory running smoothly. We call it the Visual Factory—the right information at the right time for the people who need it. Datanomix delivers it.
Use the form to access the infographic:
ROI Calculator
How much more could your shop be making with Datanomix?