What We Built: After Action Report
As detailed on our company page, we set out to build software products that are good enough in quality, usability, and reliability that you should think of them as a member of your team. Every time we hear a new pain point or challenge from a customer, we take them personally as an opportunity – if we are in a position to help, and many customers share that pain point, we’ll do everything in our power to deliver a solution.
Some of our greatest innovations as a company have evolved through this process. Our Coffee Cup Report was literally derived by sitting with a production lead early in the morning and reviewing yesterday’s performance as prep for the AM production meeting to give back 60 minutes of chasing people, paper, and parts. Our Quote Calibration Report was spawned in our early days when a customer said, “you guys already know my jobs better than I do. Can you make your data available so I can compare them to my quotes?” Now we have dozens of customers reviewing the quote calibration page as a proxy for new business and job costing.
So what exactly is the After Action Report?
The vast majority of our customers are job shops – solid mix of parts, mid-to-large lot sizes, a decent amount of repeat business, and an ingrained focus on continuous improvement. In such a company, consistent performance to target cycle times and setup times is of utmost importance to profitability and job win-ability.
Many companies hold a “post-mortem” to analyze how they ran a particular job and record what improvements or changes are needed the next time they run that job. Figuring out your actual job performance across an entire lot is virtually impossible in your ERP system. Most monitoring products will only give you the basics, such as spindle up time across the # of days the job ran. With our built-in job performance capabilities and scores, having job-specific expectations and real results across different lots you’ve run is simple and straightforward.
The After Action Report was designed to be the backdrop of your post-mortem meeting, and a guidepost for real job financial performance.
How does it work?
1.) Select the part # that you want to analyze
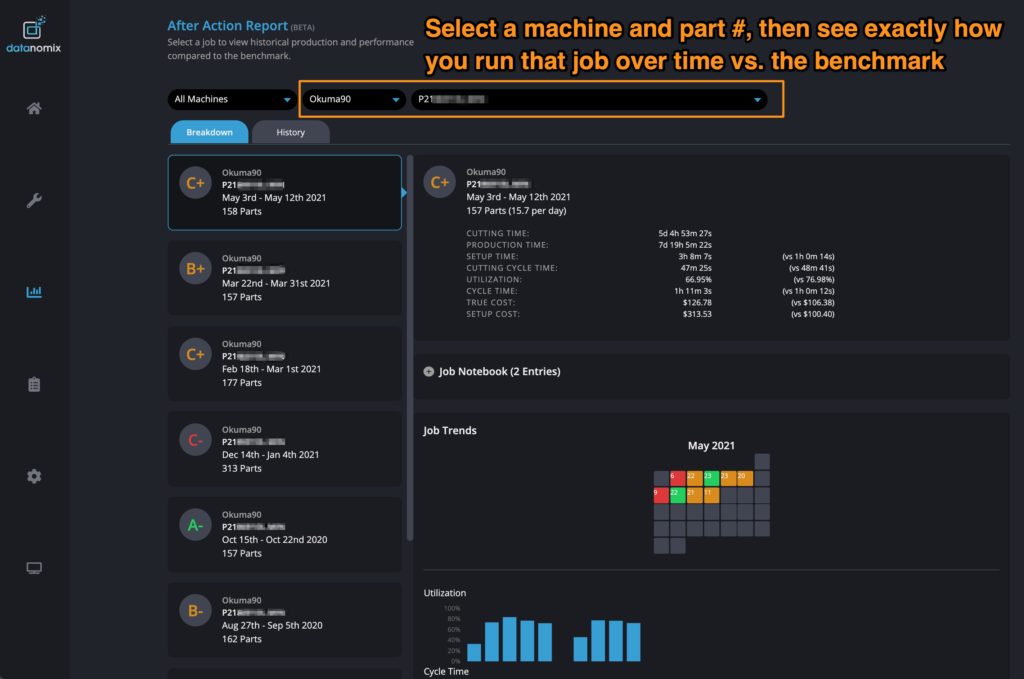
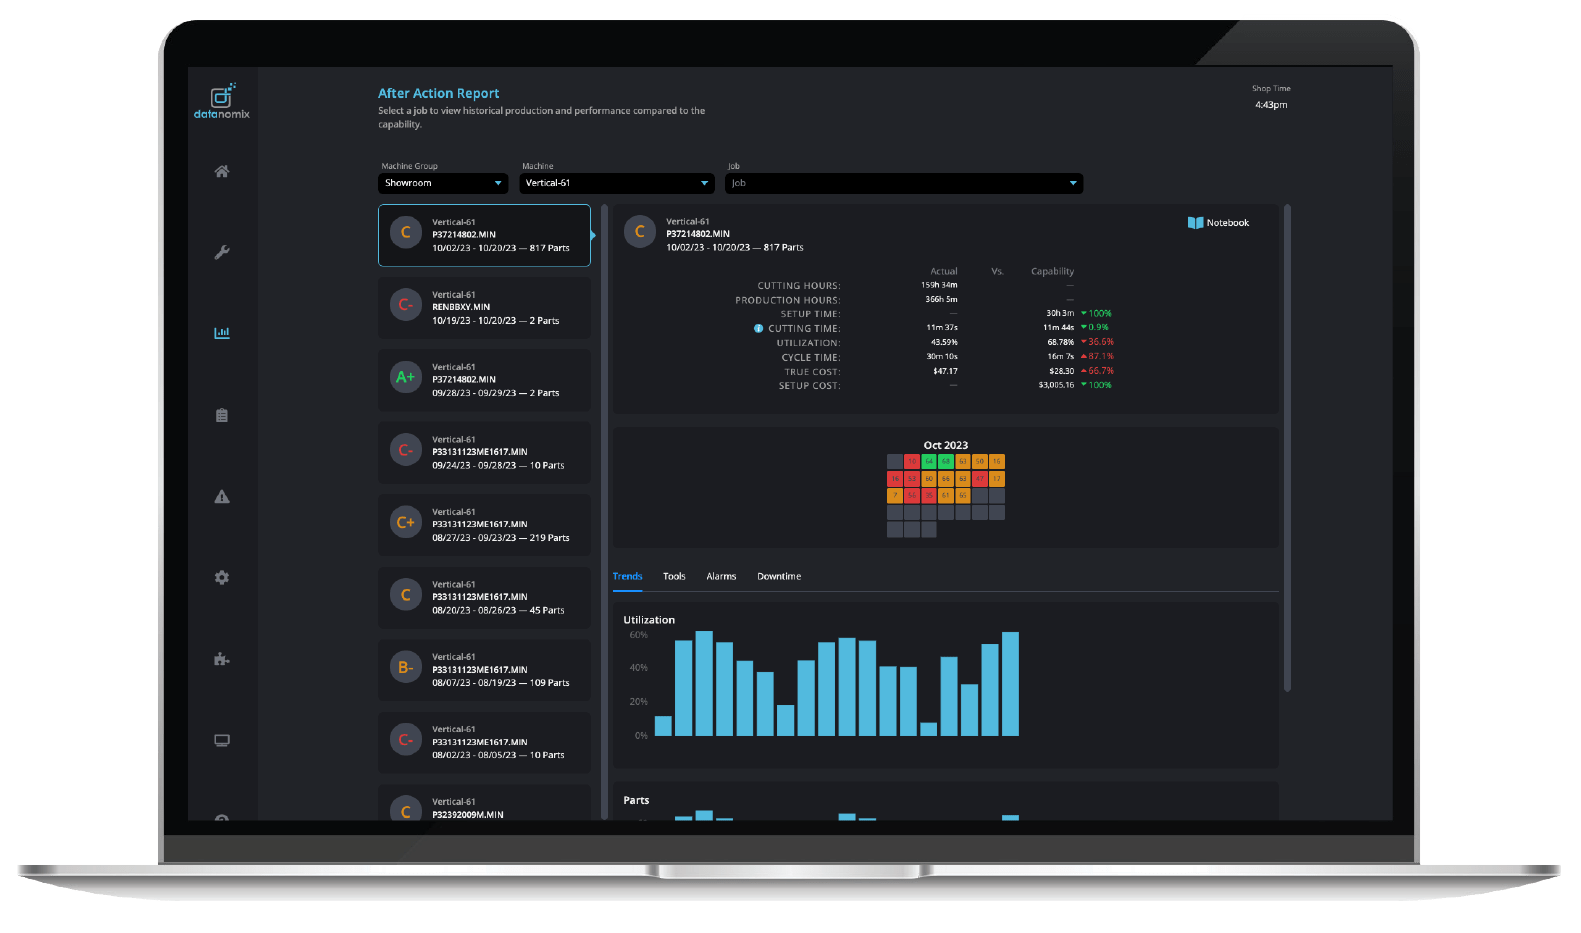
Doing so will populate the After Action Report with all the times you have run that part # and automatically group each run into a reviewable entity. As you can see above, this particular part # has run multiple times, usually for 1-2 weeks per order. Essential information is shown in the left-hand column of job runs, such as when it ran, how many parts you made, and how you scored for that entire run (A+ to C-) compared to your performance capability.
2.) Select the specific run you want to dig into
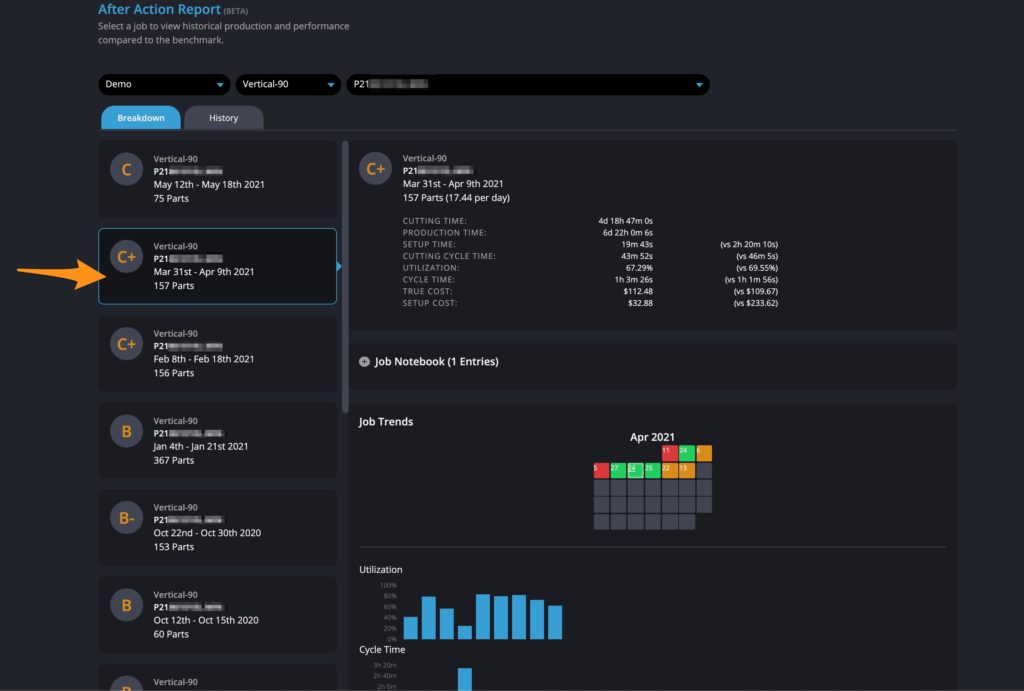
Now you’re getting into the meat of the issue—how did you perform on that particular run? Selecting a specific run will reveal all the details.

The stats panel features the key high-level metrics—real Cutting Hours and Production Hours for the whole run, actual Setup Time vs. your capability, actual Cutting Time and Cycle Time vs. your capability, and last not but not least, the True Cost implications of how you performed on that job, broken into per piece pricing implications.
3.) Go as deep as you’d like
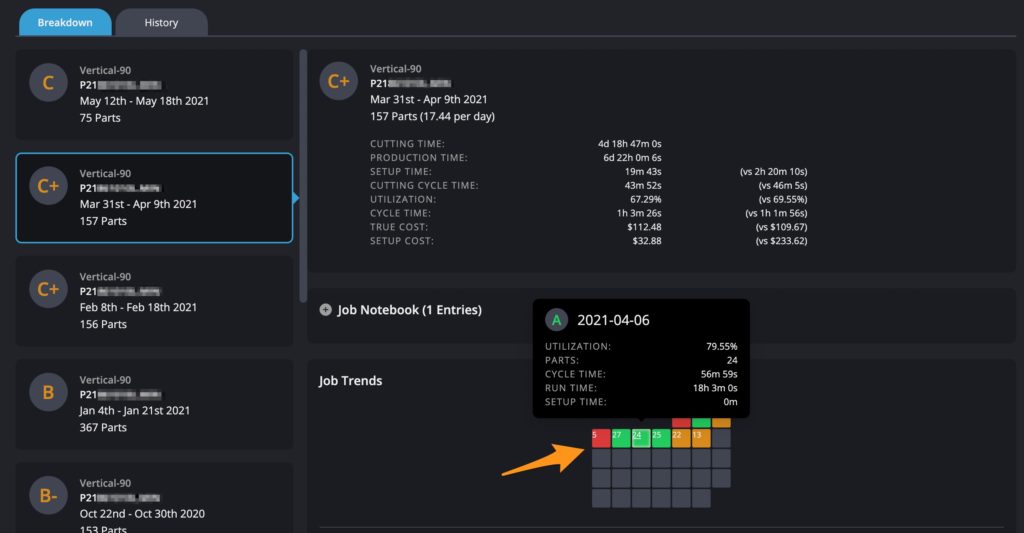
Once you are drilled into a specific run, it is easy to see how each day of performance contributed to that run. The simple calendar view shows you each day the job ran, and mousing over the calendar shows you the performance metrics of that particular day.
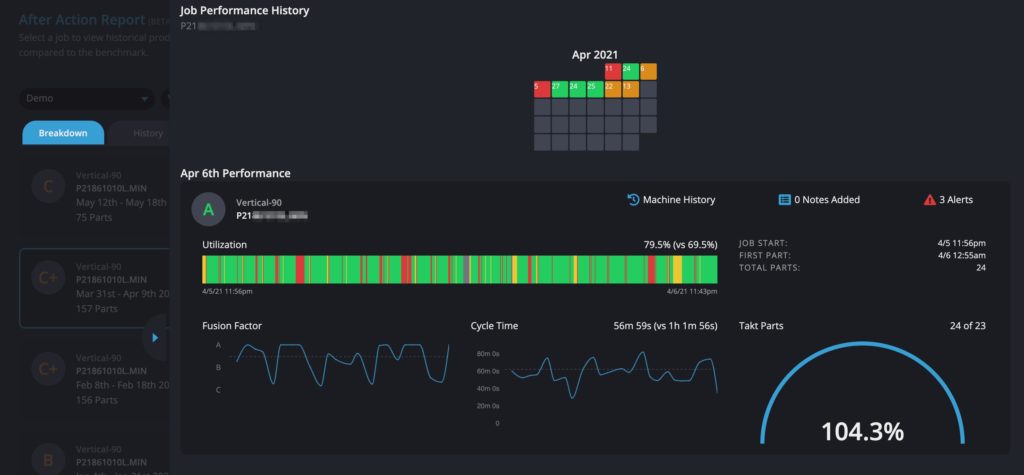
Want to go even further? Click the calendar day, and you’ll get the familiar complete visualization of what that day looked like.
4.) Record CI actions in the Job Notebook
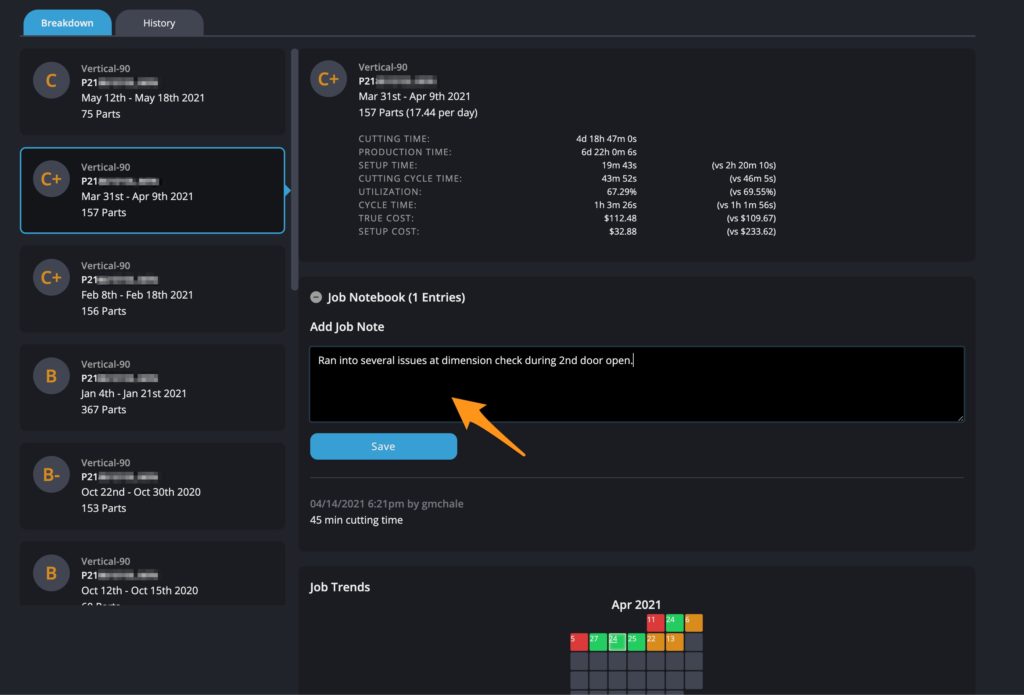
Want to record takeaways from the post-mortem discussion? The Job Notebook is the perfect place to do that, as all notes are recorded by username and date/time and saved forever with the job. Next time you run it, your notes will be right there to see what you want to tweak or be aware of before the next run.
As you can see, the After Action Report is an incredible resource for helping you understand actual job performance over time, real financial implications of how you run compared to your performance capability, and a great place to quickly deep-dive and record observations to feed Continuous Improvement initiatives.
Like what you see? Give us a shout, and we’ll be happy to show you this and the many other turnkey reports people love in our product!
