We Automate Benchmarking to Understand and Improve Your Production
Understanding where you are when you start a project is vital for any organization looking to use data to improve operations.
“If you can’t measure it, you can’t improve it.”
— Peter Drucker, Father of Modern Management
Benchmarking is the process that involves gathering and analyzing the metrics associated with your project that show where your organization is today. By setting a baseline, you’ll successfully measure your efforts as you implement Continuous Improvement programs intended to increase efficiencies.
In manufacturing, benchmarking is done around key metrics that reflect your current rates of production. This includes cycle times, machine utilization, parts made, and other indicators of whether you are on target or not. Manufacturers should benchmark any metric that shows how efficiently they are at producing parts to meet their customers’ demands while at the same time meeting their business goals. Good, bad, or indifferent, the benchmark gives you a target for improvement.
The challenge?
Effectively benchmarking your manufacturing operations is extremely difficult, creating challenges for your organization, including:
- Lots of people spend weeks or months chasing people and paper to record operator hours, part counts, machine states, alarm codes, and more to get a good sample size
- Data entered by your people can have errors—either intentional (“gaming the system”) or unintentional (“oops”)—that skew your results and benchmarks
- People with advanced analytical skills are hard to come by, and to effectively create and maintain manufacturing benchmarks, they are a prerequisite
- The number of essential benchmarks—cycle times, parts per hour, machine utilization, start times, etc.—make it difficult to create and maintain these benchmarks over time
It’s no wonder so many manufacturers “wing it” when benchmarking their operations.
Is Your Production Monitoring Next-Gen?
There are software solutions that are designed to help collect and analyze these key production metrics. Unfortunately, most of these first-generation production monitoring solutions ask you to manually benchmark your production before their solution is installed. They even want you to keep it a “secret” from your employees so they can’t game the system by underreporting activity, so the benchmark is artificially low. You do all the work to develop your benchmark for these systems by manually tracking your production for 30 days.
Don’t worry… Datanomix has your back!
Instead of manual benchmarking, Datanomix uses data directly from your CNC machine to create key benchmarks automatically. When benchmarks are derived directly from machine data, you no longer have people gathering the information needed to understand your factory’s operations, and errors are reduced because the data coming directly from the machines can’t be “gamed.”
Even better, these benchmarks are developed by the system quickly and constantly adapt to what good performance looks like for you on every job. Datanomix gives you performance standards immediately, and the standards are always being calibrated to your best-in-class performance.
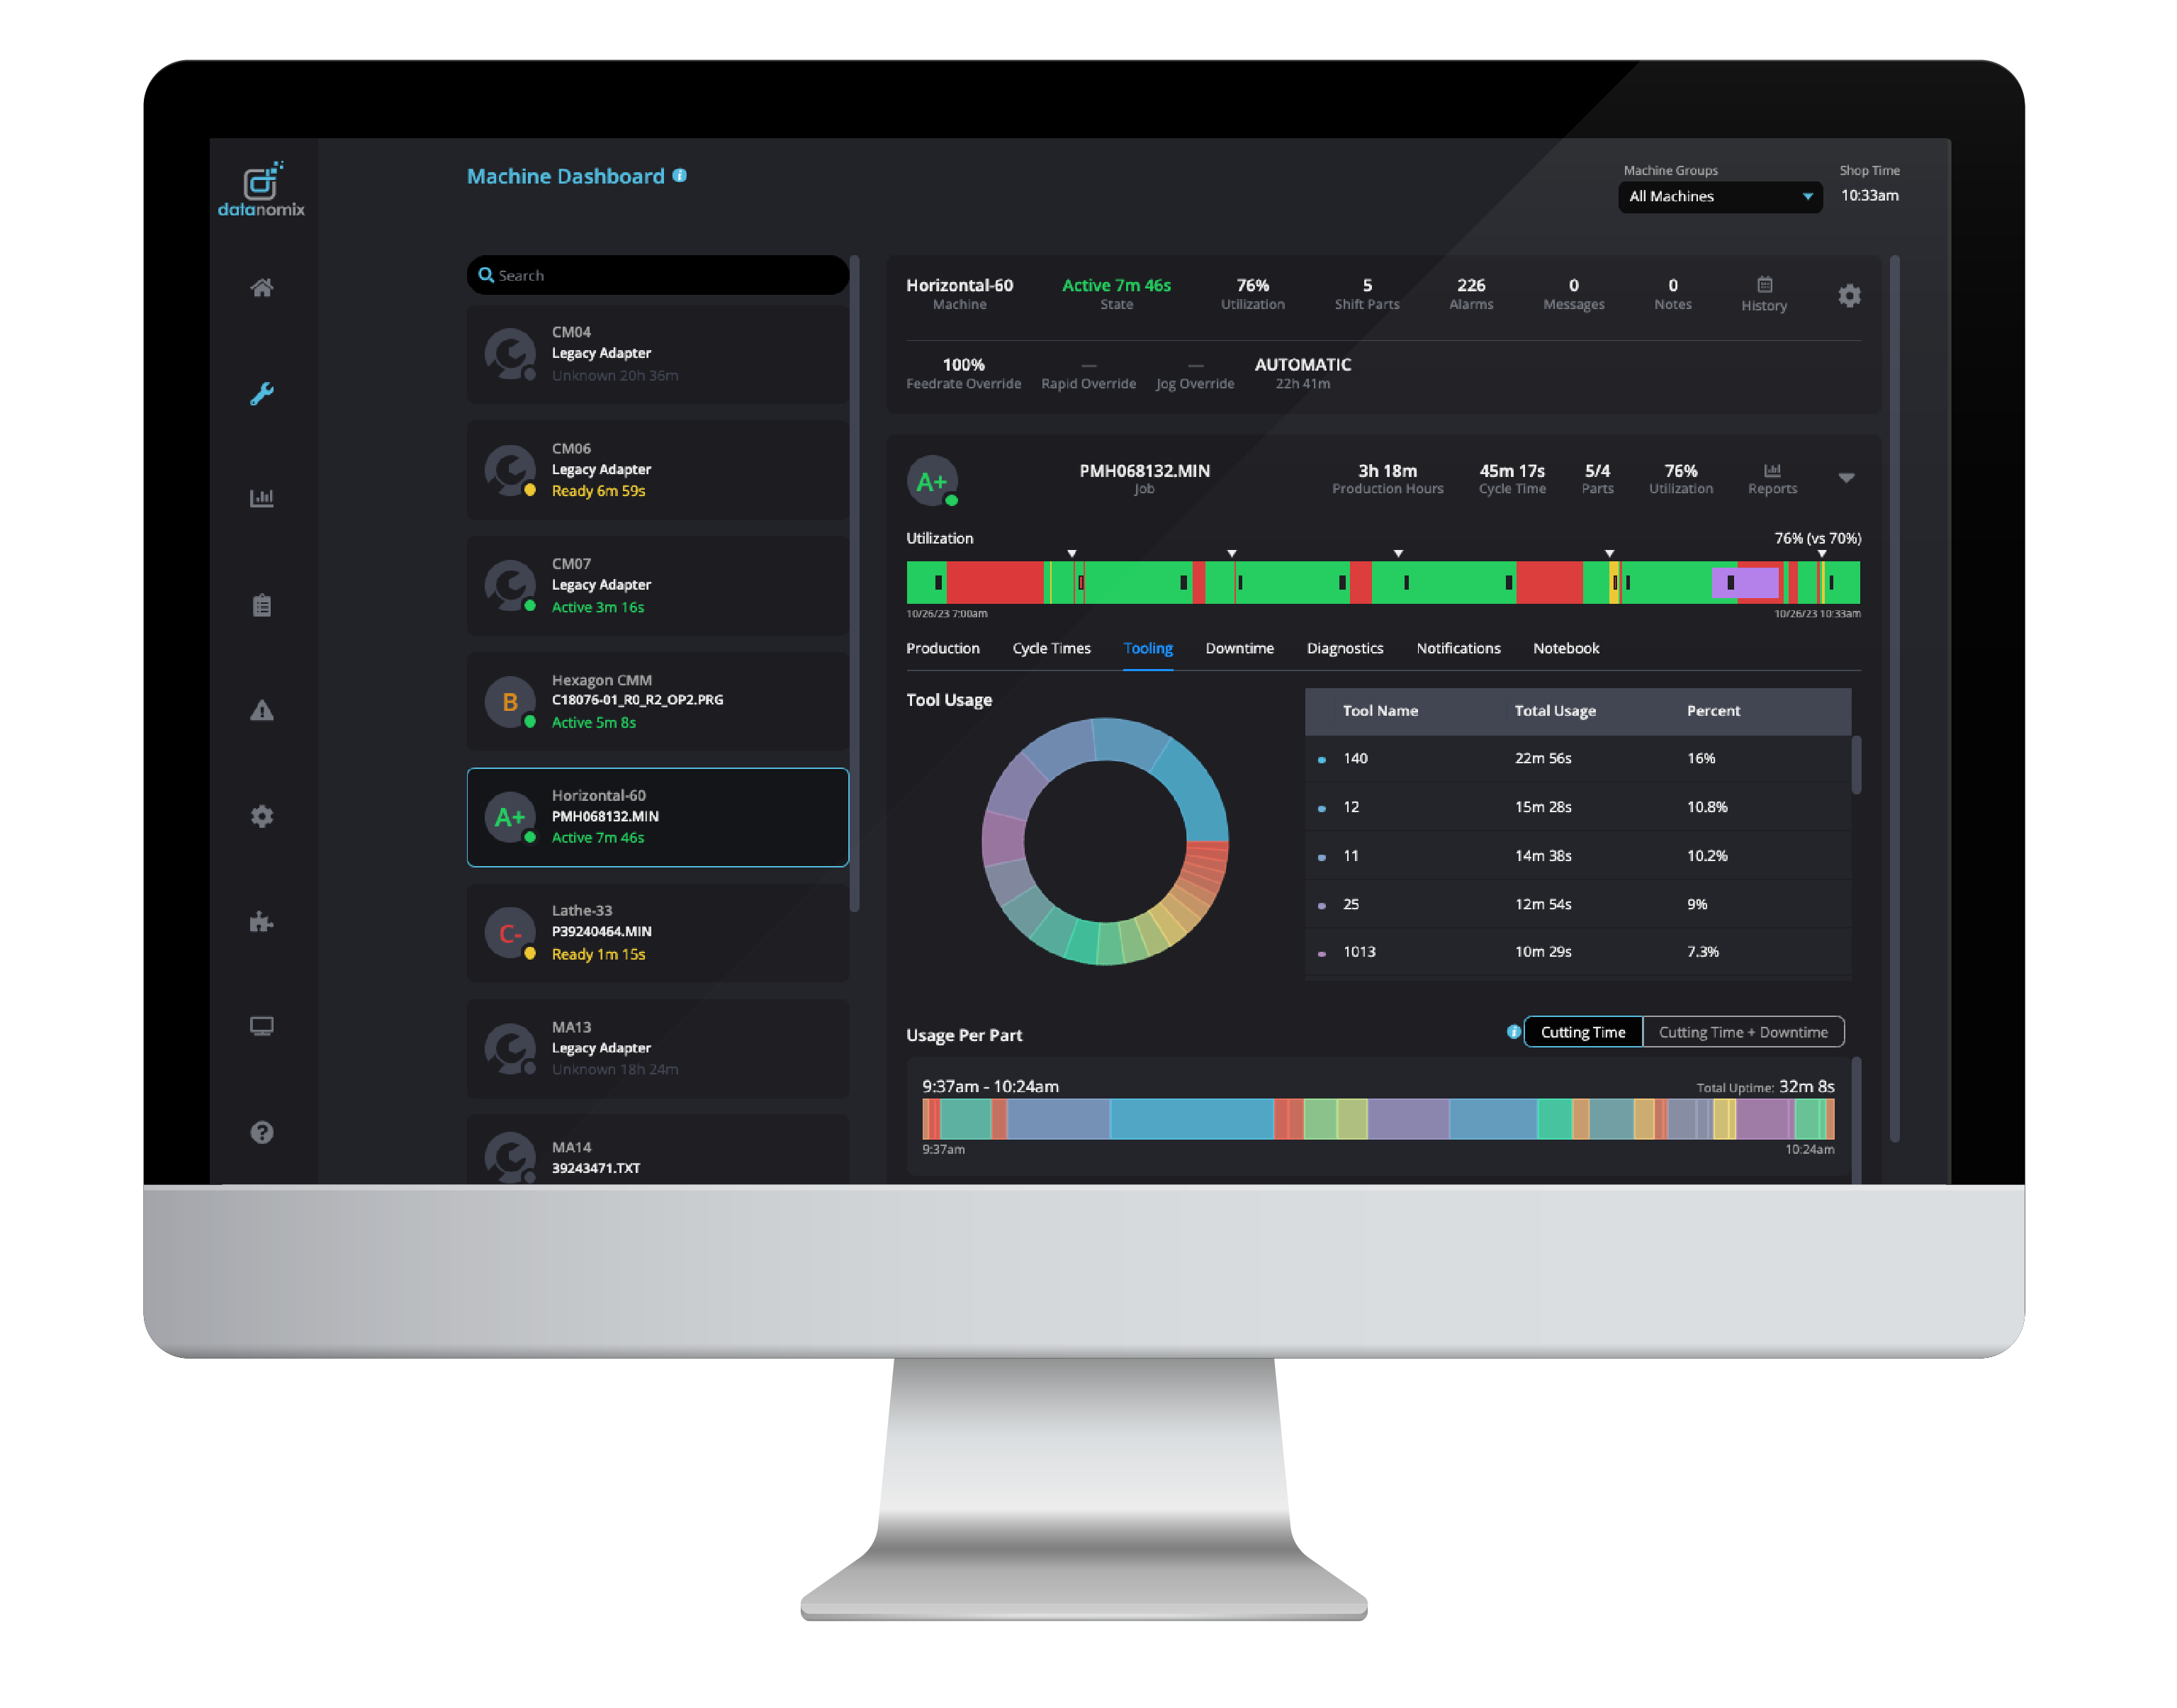
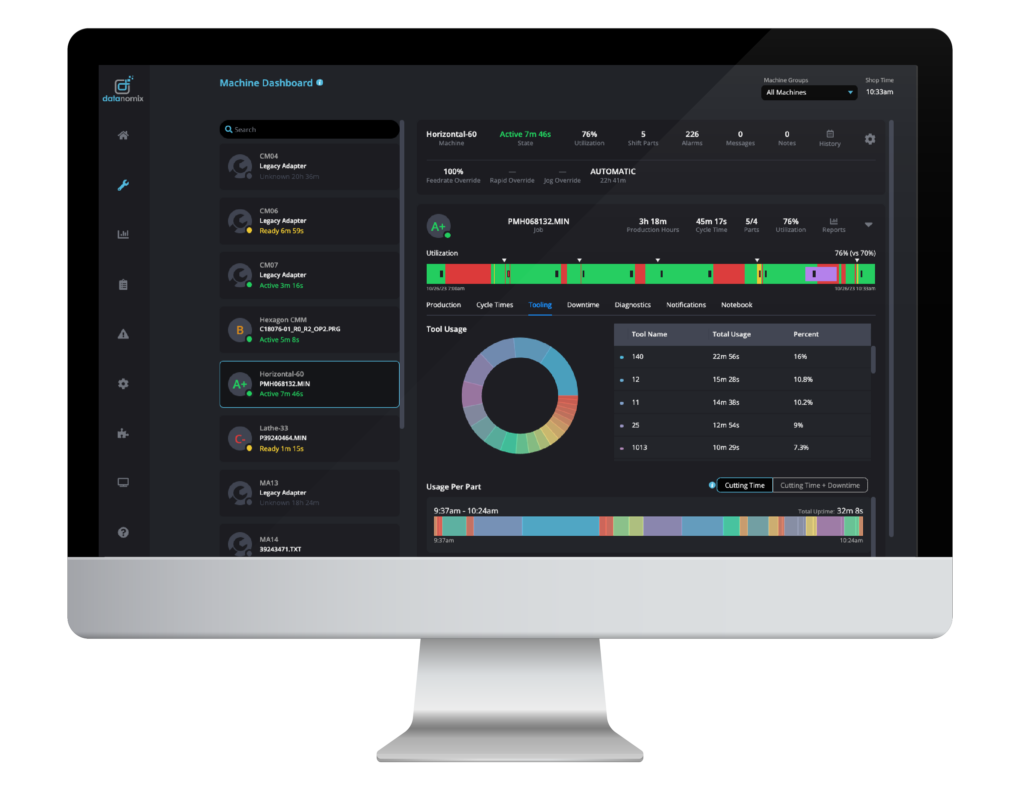
Datanomix tracks, analyzes, and visualizes several key metrics directly from machine data to build benchmarks that are used to compare against current production:
Machine Warm-Up:
Some manufacturers start machines to get them ready for an upcoming shift, saving time by allowing operators to get right into setup.
Setup Time:
Understanding and benchmarking the Setup Time gives you insights into which cells are efficient and which cells need to work on setup efficiency.
First Part:
Datanomix tracks when the first part rolls off the line, showing if operations are getting started early enough to meet production goals.
Cycle Times:
Cycle Time = Cutting Time + Touch Time, and Datanomix benchmarks both, so you get a real sense of the cutting portion and the operator touch time of your operations. This is important because managing total Cycle Time—not just cutting time—is where most efficiency opportunities exist. Datanomix also exposes Cycle Time Variability, to show which jobs are “lumpy” and opportunities for increased efficiency and profitability.
Takt Parts:
Track how many parts you should make in a specific shift or time horizon as a quick representation of productivity.
Machine Utilization:
See the overall utilization for every machine versus the expected utilization benchmark established by Datanomix.
Machine Idle:
Track when your machines are idle to understand if it’s normal behavior or not working for another reason.
Machine Stopped:
It’s easy to see when a machine is stopped on the Datanomix dashboard with a red bar in the activity timeline visualization.
Alarm Heuristics:
Keep up with alarms in real-time and monitor which alarms are important and which can be ignored.
Datanomix automatically benchmarks production as you machine parts. After running a few parts, Datanomix uses machine learning to create benchmarks based on what good production should look like. These benchmarks make shop leaders happy because they are set to a high standard of performance that we know is achievable since Datanomix has seen your jobs produced at this level.
Automated Benchmarks Drive Gains
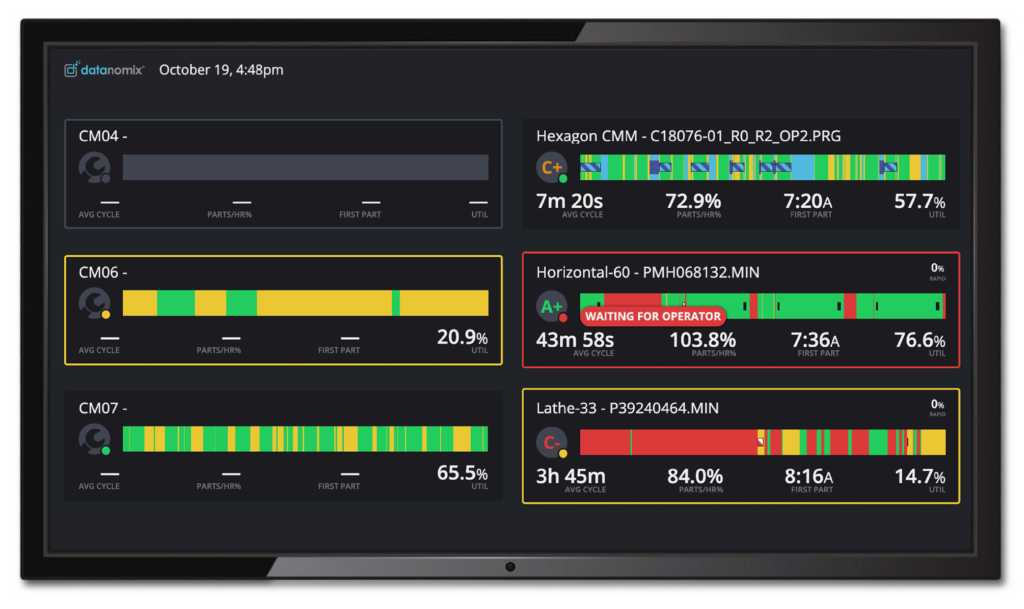
This is where the fun begins. Datanomix uses these production benchmarks to create a real-time production score for every job. As you run parts, you get a letter grade—from A plus to C minus—that indicates how that particular job is doing right now. When displayed on large-screen TVs around the shop with Datanomix TV Mode, everyone understands exactly what’s going on with every job in real time, allowing resources to flow to jobs that need attention.
Unlike first-gen production monitoring solutions, automated benchmarking is foundational to the Datanomix platform. Datanomix benchmarks—developed automatically from your actual job runs—drive not only comparisons for real-time production, but also provide insights into factory performance over time. For example, the daily Coffee Cup Report delivers all of the information needed to run successful morning production meetings, and the After Action Report offers insights into performance at a per-job and per-machine level over any given time range, helping with decision-making around staffing, job costing, and capital expenditures.
And since everyone on the team is aware of the benchmarks and working towards improving production scores, the entire factory improves. Machine utilization increases, cycle times improve, and parts quotas are met in a more predictable manner.
Over time, as your production efficiency improves with Datanomix, benchmarks are adjusted to reflect this higher level of efficiency. By recalibrating the benchmarks, your teams now look for ways to improve their scores to meet or exceed the new targets, creating a culture of continuous improvement that is reflected in the behavior of the entire organization.